Question
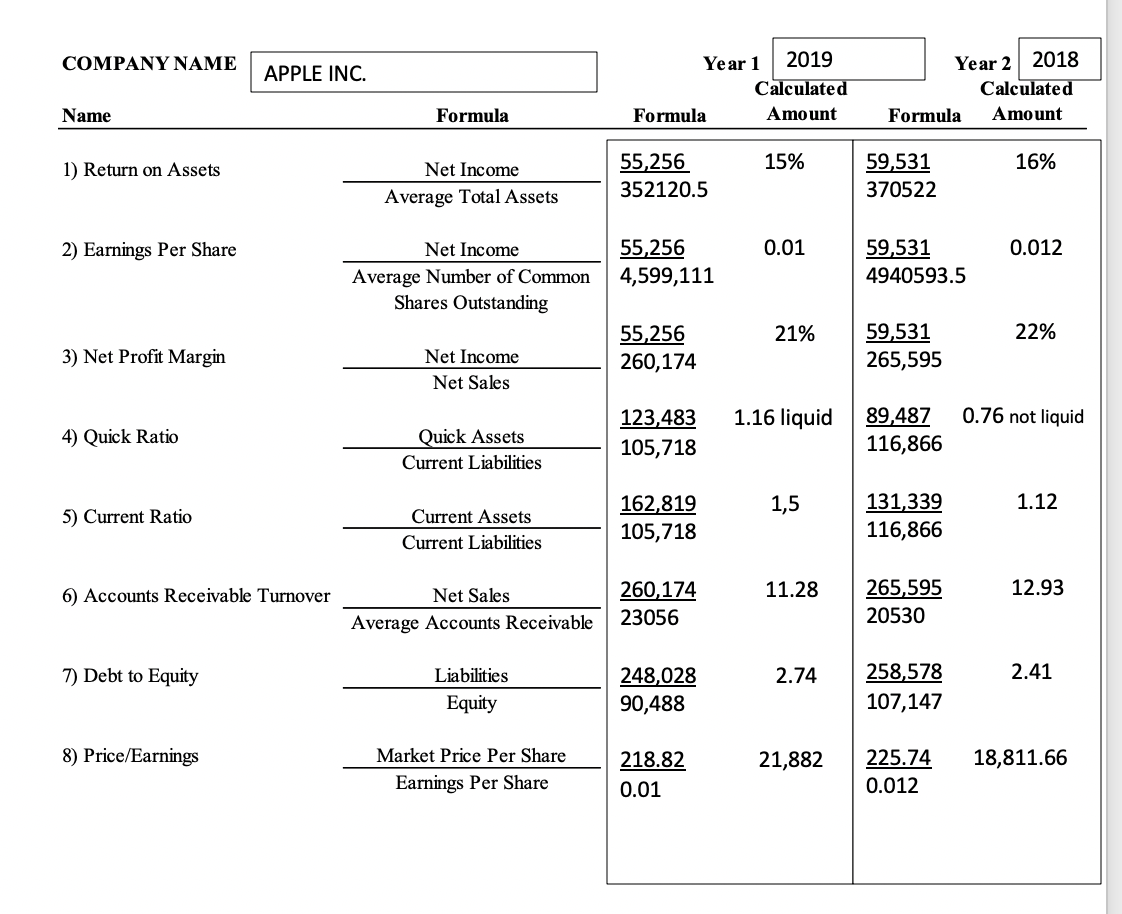
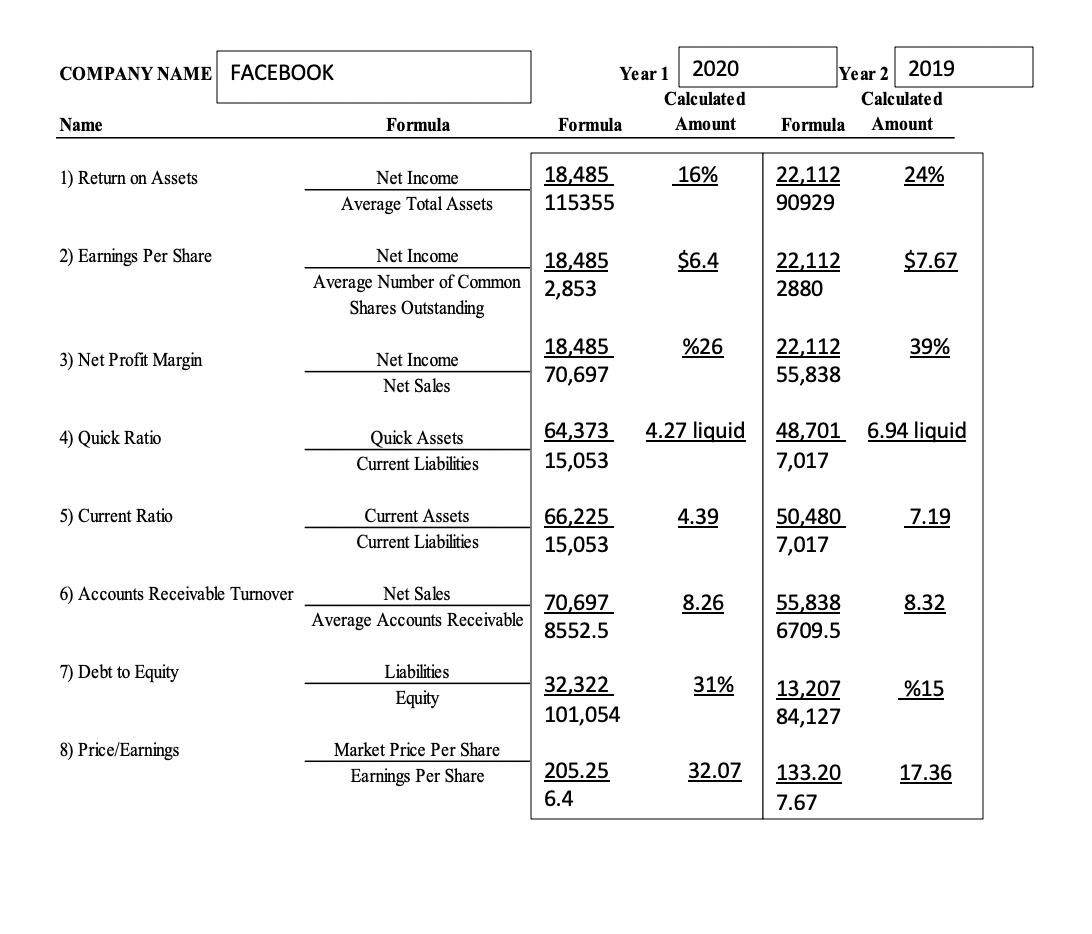
part 2: Based on the analysis performed in part 1 choose three ratios where the two companies exhibit the biggest differences. For each one, in

 part 2: Based on the analysis performed in part 1 choose three ratios where the two companies exhibit the biggest differences. For each one, in no more than two or three sentences, indicate why you think those differences exist and why they are important.
Tip: Look through the companies annual report for additional information that might help you with your analysis. The MD&A (Management discussion & analysis) will give you the managements overview of the previous year (Note that the MD&A is not audited). The Notes to the financial statements provide additional information - think of them as footnotes to the financial statements.
COMPANY NAME Year 1 2019 APPLE INC. Year 2 2018 Calculated AmountFormula Calculated Amount Name Formula Formula 15% 16% 1) Return on Assets Net Income Average Total Assets 55,256 352120.5 59,531 370522 2) Earnings Per Share 0.01 0.012 Net Income Average Number of Common Shares Outstanding 55,256 4,599,111 59,531 4940593.5 21% 22% 59,531 265,595 3) Net Profit Margin 55,256 260,174 Net Income Net Sales 1.16 liquid 0.76 not liquid 4) Quick Ratio Quick Assets Current Liabilities 123,483 105,718 89,487 116,866 1,5 1.12 5) Current Ratio Current Assets Current Liabilities 162,819 105,718 131,339 116,866 6) Accounts Receivable Turnover 11.28 12.93 Net Sales Average Accounts Receivable 260,174 23056 265,595 20530 7) Debt to Equity 2.74 2.41 Liabilities Equity 248,028 90,488 258,578 107,147 8) Price/Earnings Market Price Per Share Earnings Per Share 18,811.66 218.82 0.01 21,882 225.74 0.012 COMPANY NAME FACEBOOK Year 1 2020 Year 2 2019 Calculated Amount Calculated Amount Name Formula Formula Formula 1) Return on Assets 16% 24% Net Income Average Total Assets 18,485 115355 22,112 90929 2) Earnings Per Share $6.4 Net Income Average Number of Common Shares Outstanding 18,485 2,853 $7.67 22,112 2880 %26 39% 3) Net Profit Margin 18,485 70,697 Net Income Net Sales 22,112 55,838 4) Quick Ratio 4.27 liquid 6.94 liquid Quick Assets Current Liabilities 64,373 15,053 48,701 7,017 5) Current Ratio Current Assets Current Liabilities 66,225 15,053 4.39 50,480 7,017 7.19 6) Accounts Receivable Turnover Net Sales Average Accounts Receivable 8.26 8.32 70,697 8552.5 55,838 6709.5 7) Debt to Equity Liabilities Equity 31% %15 32,322 101,054 13,207 84,127 8) Price/Earnings Market Price Per Share Earnings Per Share 205.25 6.4 32.07 17.36 133.20 7.67
Step by Step Solution
There are 3 Steps involved in it
Step: 1

Get Instant Access to Expert-Tailored Solutions
See step-by-step solutions with expert insights and AI powered tools for academic success
Step: 2

Step: 3

Ace Your Homework with AI
Get the answers you need in no time with our AI-driven, step-by-step assistance
Get Started


