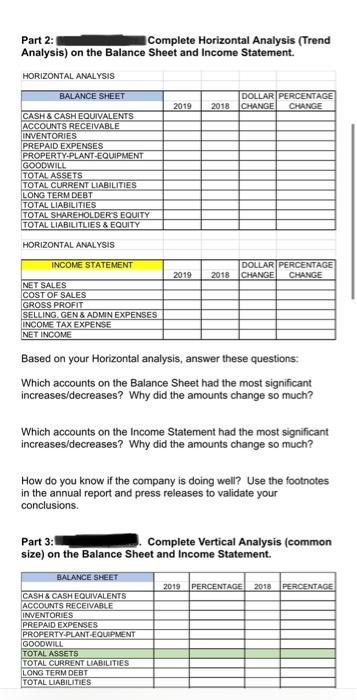
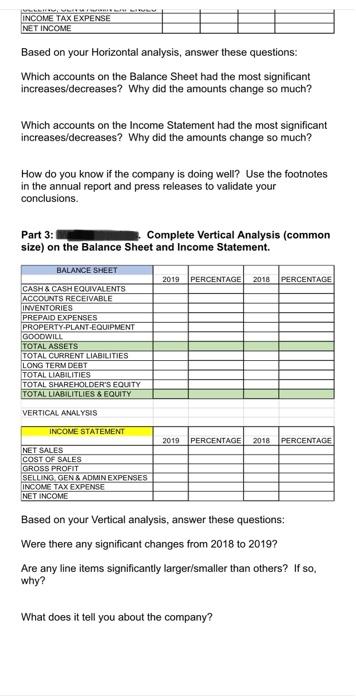
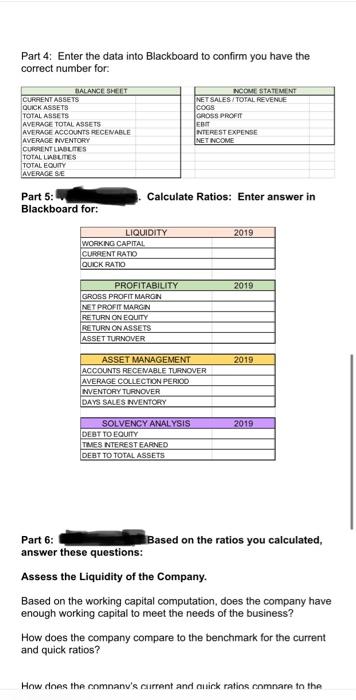
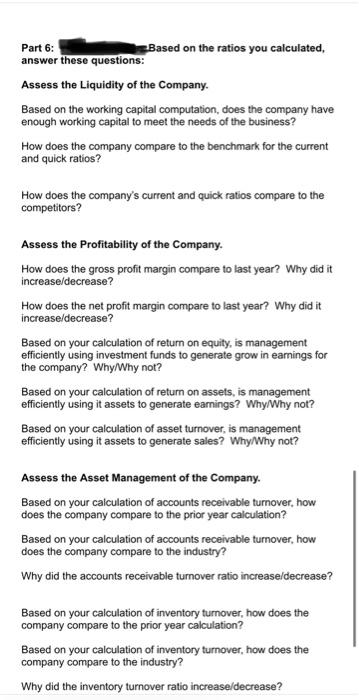
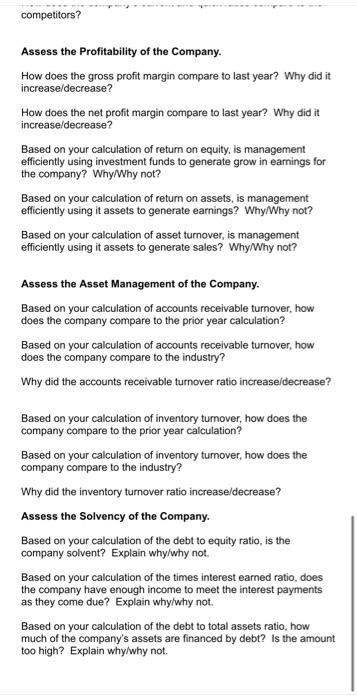
Part 2: Complete Horizontal Analysis (Trend Analysis) on the Balance Sheet and Income Statement. HORIZONTAL ANALYSIS BALANCE SHEET 2019 2018 DOLLAR PERCENTAGE CHANGE CHANGE CASH & CASH EQUIVALENTS ACCOUNTS RECEIVABLE INVENTORIES PREPAID EXPENSES PROPERTY-PLANT-EQUIPMENT GOODWILL TOTAL ASSETS TOTAL CURRENT LIABILITIES LONG TERM DEBT TOTAL LIABILITIES TOTAL SHAREHOLDER'S EQUITY TOTAL LIABILITLIES & EQUITY HORIZONTAL ANALYSIS INCOME STATEMENT 2019 2018 DOLLAR PERCENTAGE CHANGE CHANGE NET SALES COST OF SALES GROSS PROFIT SELLING. GEN & ADMIN EXPENSES INCOME TAX EXPENSE NET INCOME Based on your Horizontal analysis, answer these questions: Which accounts on the Balance Sheet had the most significant increases/decreases? Why did the amounts change so much? Which accounts on the Income Statement had the most significant increases/decreases? Why did the amounts change so much? How do you know if the company is doing well? Use the footnotes in the annual report and press releases to validate your conclusions. Part 3: Complete Vertical Analysis (common size) on the Balance Sheet and Income Statement. 2019 PERCENTAGE 2018 PERCENTAGE BALANCE SHEET CASH & CASH EQUIVALENTS ACCOUNTS RECEIVABLE INVENTORIES PREPAID EXPENSES PROPERTY PLANT EQUIPMENT GOODWILL TOTAL ASSETS TOTAL CURRENT LIABILITIES LONG TERM DEBT TOTAL LIABILITIES INCOME TAX EXPENSE NET INCOME Based on your Horizontal analysis, answer these questions: Which accounts on the Balance Sheet had the most significant increases/decreases? Why did the amounts change so much? Which accounts on the Income Statement had the most significant increases/decreases? Why did the amounts change so much? How do you know if the company is doing well? Use the footnotes in the annual report and press releases to validate your conclusions. Part 3: Complete Vertical Analysis (common size) on the Balance Sheet and Income Statement. BALANCE SHEET 2019 PERCENTAGE 2018 PERCENTAGE CASH & CASH EQUIVALENTS ACCOUNTS RECEIVABLE INVENTORIES PREPAID EXPENSES PROPERTY-PLANT-EQUIPMENT GOODWILL TOTAL ASSETS TOTAL CURRENT LIABILITIES LONG TERM DEBT TOTAL LIABILITIES TOTAL SHAREHOLDER'S EQUITY TOTAL LIABILITLIES & EQUITY VERTICAL ANALYSIS INCOME STATEMENT 2019 PERCENTAGE 2018 PERCENTAGE NET SALES COST OF SALES GROSS PROFIT SELLING GEN & ADMIN EXPENSES INCOME TAX EXPENSE NET INCOME Based on your Vertical analysis, answer these questions: Were there any significant changes from 2018 to 2019? Are any line items significantly larger/smaller than others? If so, why? What does it tell you about the company? Part 4: Enter the data into Blackboard to confirm you have the correct number for DIALANCE SHEET CURRENT ASSETS QUICK ASSETS TOTAL ASSETS AVERAGE TOTAL ASSETS AVERAGE ACCOUNTS RECENABLE AVERAGE NVENTORY CURRENT LIABLES TOTAL LABUTES TOTAL EQUITY AVERAGE SE INCOME STATEMENT NET SALES/TOTAL REVENUE COGS GROSS PROFIT EDIT INTEREST EXPENSE NET NCOME Calculate Ratios: Enter answer in Part 5: Blackboard for: 2019 LIQUIDITY WORKING CAPITAL CURRENT RATIO QUICK RATIO 2019 PROFITABILITY GROSS PROFIT MARGN NET PROFIT MARGN RETURN ON EQUITY RETURN ON ASSETS ASSET TURNOVER 2019 ASSET MANAGEMENT ACCOUNTS RECENABLE TURNOVER AVERAGE COLLECTION PERIOD INVENTORY TURNOVER DAYS SALES INVENTORY 2019 SOLVENCY ANALYSIS DEBT TO EQUITY TIMES INTEREST EARNED DEBT TO TOTAL ASSETS Part 6: Based on the ratios you calculated, answer these questions: Assess the Liquidity of the Company. Based on the working capital computation does the company have enough working capital to meet the needs of the business? How does the company compare to the benchmark for the current and quick ratios? How does the comnany's current and uick ratins comnare to the Part 6: Based on the ratios you calculated, answer these questions: Assess the Liquidity of the Company. Based on the working capital computation, does the company have enough working capital to meet the needs of the business? How does the company compare to the benchmark for the current and quick ratios? How does the company's current and quick ratios compare to the competitors? Assess the Profitability of the Company. How does the gross profit margin compare to last year? Why did it increase/decrease? How does the net profit margin compare to last year? Why did it increase/decrease? Based on your calculation of return on equity, is management efficiently using investment funds to generate grow in earnings for the company? Why/Why not? Based on your calculation of return on assets, is management efficiently using it assets to generate earnings? Why/Why not? Based on your calculation of asset turnover, is management efficiently using it assets to generate sales? Why/Why not? Assess the Asset Management of the Company. Based on your calculation of accounts receivable turnover, how does the company compare to the prior year calculation? Based on your calculation of accounts receivable turnover, how does the company compare to the industry? Why did the accounts receivable turnover ratio increase/decrease? Based on your calculation of inventory turnover, how does the company compare to the prior year calculation? Based on your calculation of inventory turnover, how does the company compare to the industry? Why did the inventory turnover ratio increase/decrease? competitors? Assess the Profitability of the Company. How does the gross profit margin compare to last year? Why did it increase/decrease? How does the net profit margin compare to last year? Why did it increase/decrease? Based on your calculation of return on equity, is management efficiently using investment funds to generate grow in earnings for the company? Why/Why not? Based on your calculation of return on assets, is management efficiently using it assets to generate earnings? Why/Why not? Based on your calculation of asset turnover, is management efficiently using it assets to generate sales? Why/Why not? Assess the Asset Management of the Company. Based on your calculation of accounts receivable turnover, how does the company compare to the prior year calculation? Based on your calculation of accounts receivable tumover, how does the company compare to the industry? Why did the accounts receivable turnover ratio increase/decrease? Based on your calculation of inventory turnover, how does the company compare to the prior year calculation? Based on your calculation of inventory turnover, how does the company compare to the industry? Why did the inventory turnover ratio increase/decrease? Assess the Solvency of the Company. Based on your calculation of the debt to equity ratio, is the company solvent? Explain whylwhy not. Based on your calculation of the times interest earned ratio, does the company have enough income to meet the interest payments as they come due? Explain whylwhy not. Based on your calculation of the debt to total assets ratio, how much of the company's assets are financed by debt? Is the amount too high? Explain why why not. Part 2: Complete Horizontal Analysis (Trend Analysis) on the Balance Sheet and Income Statement. HORIZONTAL ANALYSIS BALANCE SHEET 2019 2018 DOLLAR PERCENTAGE CHANGE CHANGE CASH & CASH EQUIVALENTS ACCOUNTS RECEIVABLE INVENTORIES PREPAID EXPENSES PROPERTY-PLANT-EQUIPMENT GOODWILL TOTAL ASSETS TOTAL CURRENT LIABILITIES LONG TERM DEBT TOTAL LIABILITIES TOTAL SHAREHOLDER'S EQUITY TOTAL LIABILITLIES & EQUITY HORIZONTAL ANALYSIS INCOME STATEMENT 2019 2018 DOLLAR PERCENTAGE CHANGE CHANGE NET SALES COST OF SALES GROSS PROFIT SELLING. GEN & ADMIN EXPENSES INCOME TAX EXPENSE NET INCOME Based on your Horizontal analysis, answer these questions: Which accounts on the Balance Sheet had the most significant increases/decreases? Why did the amounts change so much? Which accounts on the Income Statement had the most significant increases/decreases? Why did the amounts change so much? How do you know if the company is doing well? Use the footnotes in the annual report and press releases to validate your conclusions. Part 3: Complete Vertical Analysis (common size) on the Balance Sheet and Income Statement. 2019 PERCENTAGE 2018 PERCENTAGE BALANCE SHEET CASH & CASH EQUIVALENTS ACCOUNTS RECEIVABLE INVENTORIES PREPAID EXPENSES PROPERTY PLANT EQUIPMENT GOODWILL TOTAL ASSETS TOTAL CURRENT LIABILITIES LONG TERM DEBT TOTAL LIABILITIES INCOME TAX EXPENSE NET INCOME Based on your Horizontal analysis, answer these questions: Which accounts on the Balance Sheet had the most significant increases/decreases? Why did the amounts change so much? Which accounts on the Income Statement had the most significant increases/decreases? Why did the amounts change so much? How do you know if the company is doing well? Use the footnotes in the annual report and press releases to validate your conclusions. Part 3: Complete Vertical Analysis (common size) on the Balance Sheet and Income Statement. BALANCE SHEET 2019 PERCENTAGE 2018 PERCENTAGE CASH & CASH EQUIVALENTS ACCOUNTS RECEIVABLE INVENTORIES PREPAID EXPENSES PROPERTY-PLANT-EQUIPMENT GOODWILL TOTAL ASSETS TOTAL CURRENT LIABILITIES LONG TERM DEBT TOTAL LIABILITIES TOTAL SHAREHOLDER'S EQUITY TOTAL LIABILITLIES & EQUITY VERTICAL ANALYSIS INCOME STATEMENT 2019 PERCENTAGE 2018 PERCENTAGE NET SALES COST OF SALES GROSS PROFIT SELLING GEN & ADMIN EXPENSES INCOME TAX EXPENSE NET INCOME Based on your Vertical analysis, answer these questions: Were there any significant changes from 2018 to 2019? Are any line items significantly larger/smaller than others? If so, why? What does it tell you about the company? Part 4: Enter the data into Blackboard to confirm you have the correct number for DIALANCE SHEET CURRENT ASSETS QUICK ASSETS TOTAL ASSETS AVERAGE TOTAL ASSETS AVERAGE ACCOUNTS RECENABLE AVERAGE NVENTORY CURRENT LIABLES TOTAL LABUTES TOTAL EQUITY AVERAGE SE INCOME STATEMENT NET SALES/TOTAL REVENUE COGS GROSS PROFIT EDIT INTEREST EXPENSE NET NCOME Calculate Ratios: Enter answer in Part 5: Blackboard for: 2019 LIQUIDITY WORKING CAPITAL CURRENT RATIO QUICK RATIO 2019 PROFITABILITY GROSS PROFIT MARGN NET PROFIT MARGN RETURN ON EQUITY RETURN ON ASSETS ASSET TURNOVER 2019 ASSET MANAGEMENT ACCOUNTS RECENABLE TURNOVER AVERAGE COLLECTION PERIOD INVENTORY TURNOVER DAYS SALES INVENTORY 2019 SOLVENCY ANALYSIS DEBT TO EQUITY TIMES INTEREST EARNED DEBT TO TOTAL ASSETS Part 6: Based on the ratios you calculated, answer these questions: Assess the Liquidity of the Company. Based on the working capital computation does the company have enough working capital to meet the needs of the business? How does the company compare to the benchmark for the current and quick ratios? How does the comnany's current and uick ratins comnare to the Part 6: Based on the ratios you calculated, answer these questions: Assess the Liquidity of the Company. Based on the working capital computation, does the company have enough working capital to meet the needs of the business? How does the company compare to the benchmark for the current and quick ratios? How does the company's current and quick ratios compare to the competitors? Assess the Profitability of the Company. How does the gross profit margin compare to last year? Why did it increase/decrease? How does the net profit margin compare to last year? Why did it increase/decrease? Based on your calculation of return on equity, is management efficiently using investment funds to generate grow in earnings for the company? Why/Why not? Based on your calculation of return on assets, is management efficiently using it assets to generate earnings? Why/Why not? Based on your calculation of asset turnover, is management efficiently using it assets to generate sales? Why/Why not? Assess the Asset Management of the Company. Based on your calculation of accounts receivable turnover, how does the company compare to the prior year calculation? Based on your calculation of accounts receivable turnover, how does the company compare to the industry? Why did the accounts receivable turnover ratio increase/decrease? Based on your calculation of inventory turnover, how does the company compare to the prior year calculation? Based on your calculation of inventory turnover, how does the company compare to the industry? Why did the inventory turnover ratio increase/decrease? competitors? Assess the Profitability of the Company. How does the gross profit margin compare to last year? Why did it increase/decrease? How does the net profit margin compare to last year? Why did it increase/decrease? Based on your calculation of return on equity, is management efficiently using investment funds to generate grow in earnings for the company? Why/Why not? Based on your calculation of return on assets, is management efficiently using it assets to generate earnings? Why/Why not? Based on your calculation of asset turnover, is management efficiently using it assets to generate sales? Why/Why not? Assess the Asset Management of the Company. Based on your calculation of accounts receivable turnover, how does the company compare to the prior year calculation? Based on your calculation of accounts receivable tumover, how does the company compare to the industry? Why did the accounts receivable turnover ratio increase/decrease? Based on your calculation of inventory turnover, how does the company compare to the prior year calculation? Based on your calculation of inventory turnover, how does the company compare to the industry? Why did the inventory turnover ratio increase/decrease? Assess the Solvency of the Company. Based on your calculation of the debt to equity ratio, is the company solvent? Explain whylwhy not. Based on your calculation of the times interest earned ratio, does the company have enough income to meet the interest payments as they come due? Explain whylwhy not. Based on your calculation of the debt to total assets ratio, how much of the company's assets are financed by debt? Is the amount too high? Explain why why not
