

Answered step by step
Verified Expert Solution
Question
1 Approved Answer
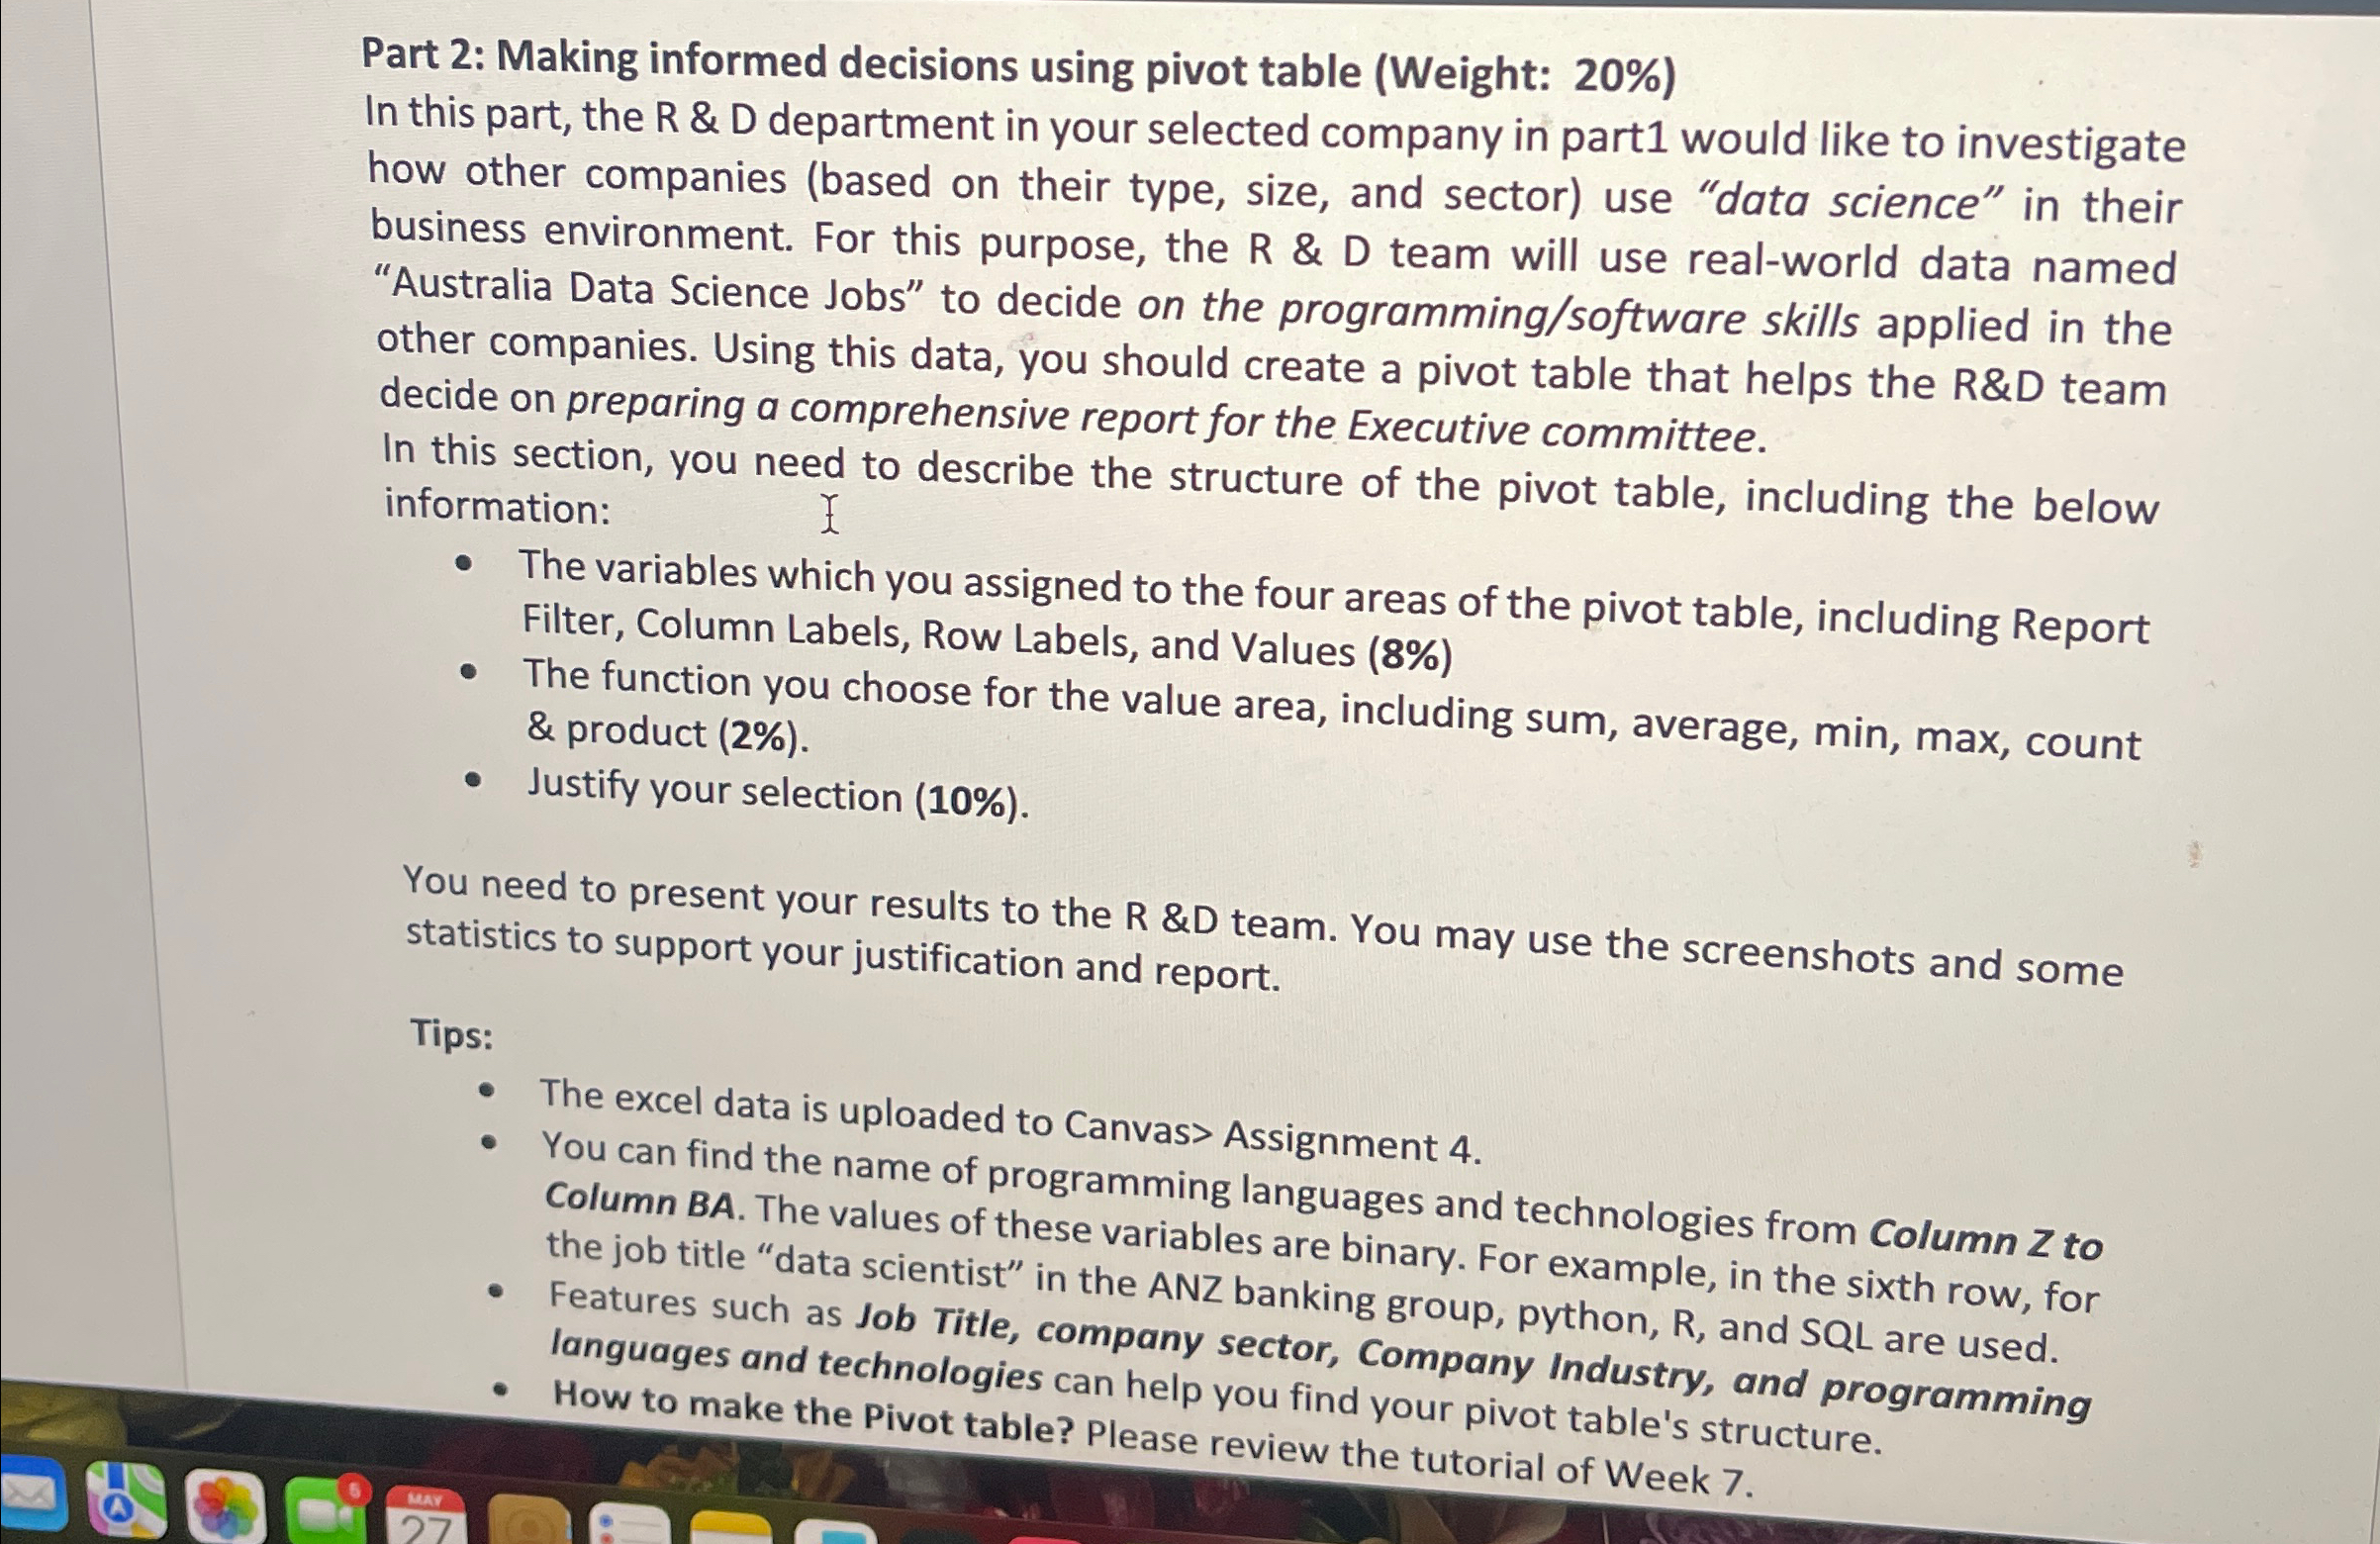
Part 2 : Making informed decisions using pivot table ( Weight: 2 0 % ) In this part, the R & D department in your
Part : Making informed decisions using pivot table Weight:
In this part, the R & D department in your selected company in part would like to investigate how other companies based on their type, size, and sector use "data science" in their business environment. For this purpose, the R & D team will use realworld data named "Australia Data Science Jobs" to decide on the programmingsoftware skills applied in the other companies. Using this data, you should create a pivot table that helps the R&D team decide on preparing a comprehensive report for the Executive committee.
In this section, you need to describe the structure of the pivot table, including the below information:
The variables which you assigned to the four areas of the pivot table, including Report Filter, Column Labels, Row Labels, and Values
The function you choose for the value area, including sum, average, min, max, count & product
Justify your selection
You need to present your results to the R & team. You may use the screenshots and some statistics to support your justification and report.
Tips:
The excel data is uploaded to Canvas Assignment
You can find the name of programming languages and technologies from Column to Column BA The values of these variables are binary. For example, in the sixth row, for the job title "data scientist" in the ANZ banking group, python, R and SQL are used.
Features such as Job Title, company sector, Company Industry, and programming languages and technologies can help you find your pivot table's structure.
How to make the Pivot table? Please review the tutorial of Week
Step by Step Solution
There are 3 Steps involved in it
Step: 1

Get Instant Access to Expert-Tailored Solutions
See step-by-step solutions with expert insights and AI powered tools for academic success
Step: 2

Step: 3
Ace Your Homework with AI
Get the answers you need in no time with our AI-driven, step-by-step assistance
Get Started
Lnai 12458 Machine Learning And Knowledge Discovery In Databases European Conference Ecml Pkdd 2020 Ghent Belgium September 14 18 2020 Proceedings Part 2 Lnai 12458
Authors: Frank Hutter ,Kristian Kersting ,Jefrey Lijffijt ,Isabel Valera
1st Edition
3030676609, 978-3030676605