

Question
Part 2: Module 6: Loan Analysis Loan Request: The Eco Foods is a Natural Foods Company, headquartered in Boulder, Colorado that specializes in natural &
Part 2: Module 6: Loan Analysis
Loan Request:
The Eco Foods is a Natural Foods Company, headquartered in Boulder, Colorado that specializes in natural & organic foods, and is requesting a loan from Boulder Bancorp in December 2020. The purpose of Eco Foods loan request for $40 thousand is to finance the purchase of new, more energy efficient freezers for its stores, that it expects to reduce its fixed operating expenses each year starting in 2021 by $10 thousand a year. The new freezers will have a depreciation expense for each year of $4 thousand.
Eco Foods has supplied copies of its financial statements on an excel spreadsheet for the bank, including historical statements for 2019 and 2020, and Eco Foods forecast statements for 2021. The assumptions Eco Foods used to do its forecast financial statements for 2021 are based on the following assumptions for your information:
Assumptions Used for the Forecast 2021 Income Statement Shown on the Spreadsheet Financial Statements posted in Module 5:
(FNCE 3600Ex2Part1Spreadsheet2020)
(1) Forecast sales will grow 9% in 2021, similar to the growth rate in sales of 9% from 2019 to 2020 (i.e. [(769,030/705,499)] 1 = .09 or 9%.
(2) The Cost of revenue will growth at the same 9% rate.
(3) Previous Operating expenses of $83,164 that are variable will grow by 9%, and $83,164 that are fixed will be lower by $10 thousand with the new more energy efficient freezers. Other expenses will stay the same, and depreciation expense will rise by $4 thousand in 2021.
(4) Interest expenses are expected to rise by $4 thousand in 2021 (based on a 10% interest rate on the $40 thousand loan balance for the new freezers). The firms average tax rate is assumed to be the same as in 2020, as 33%. A dividend will be paid to shareholders equal to $5,000 thousand in 2021.
(5) For the $40 thousand loan, the terms will be a 10-year amortized loan,
with a 10% annual interest rate and annual payments, so the annual loan payment will be [$40,000 / (PVIFA 10%, 10)] = [$40 thou. / 6.1446] = $6.51 thousand, and the amortization payment for year 1 will be: [interest portion $4 thousand principal portion $2.51 thousand, which reduces the loan balance at the end of 2021 by the principal amount paid of $2.51 thousand].
Asset Forecast: Assumptions Used for Forecast
- Accounts receivables, and inventory will grow the same rate as sales at 9%,
and Cash = Balancing item = [Total Forecast Liabs & Equity ] [Total Forecast Assets excluding Cash].
- NPP&E in 2021 will be equal to Previous NPP&E + [$40 thousand - $4 thousand depreciation expense for 2021].
Liab. & Equity Forecast: Assumptions Used for Forecast
- Accounts Payable & Accrued Liabilities will grow at same 9% as sales.
- Long-term Debt = (Previous Years LT Debt) + ($40 thousand new LTD)
- [Principal Loan Payment for 2021 of $2.51 thousand]
---------------------------------------------------------------------------------------
Loan Analysis:
Questions to Answer for a Financial & Credit Analysis for Eco Foods
Use the information on the excel spreadsheet for your analysis.
FNCE3600Ex2Part1Spreadshpr2020.xlsx posted in Module 6,
- Do a Financial Credit Analysis for Eco Foods
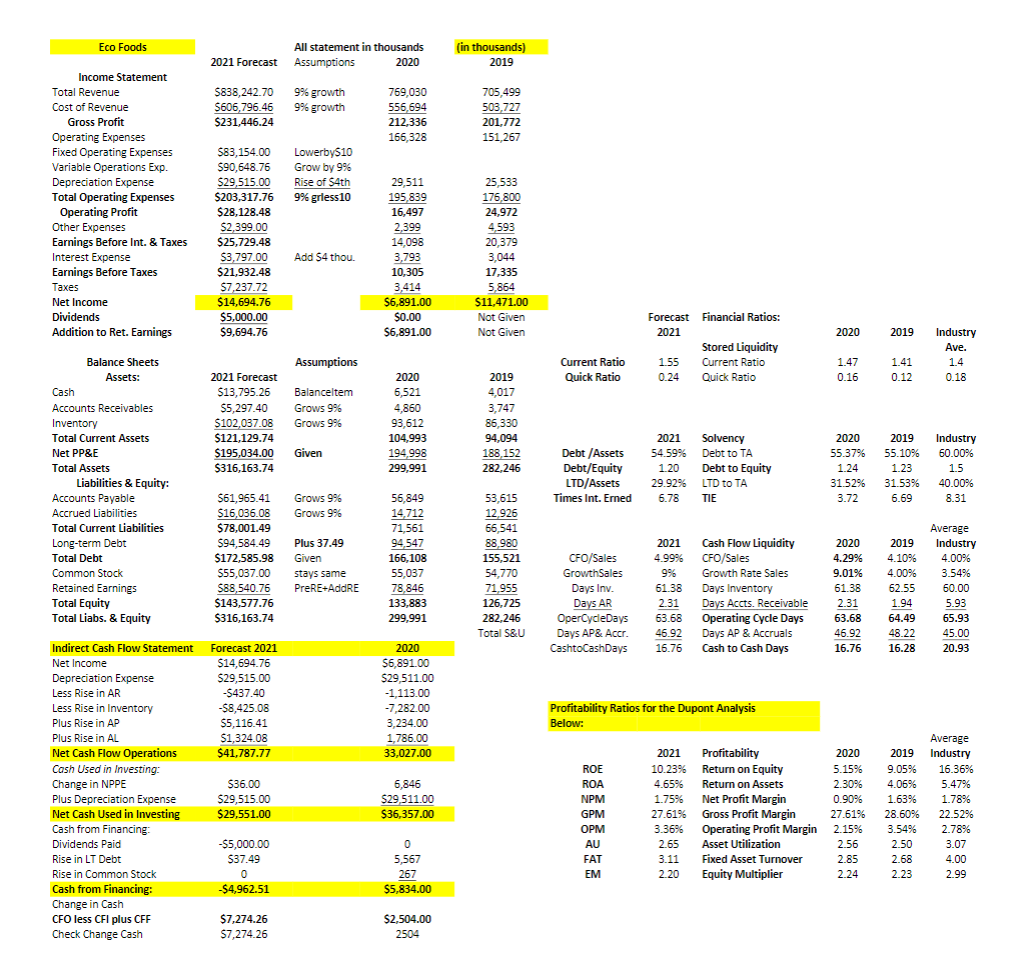
QUESTION: Do a trend and industry comparison analysis for Eco Foods cash flow liquidity ratios including its Cash Flow from Operations to Sales ratio, days inventory, days accounts receivable, and days accounts payable and accrued liabilities, and cash to cash conversion days (AR days + inventory days AP& Accrued Liabilities Days).
Eco Foods All statement in thousands Assumptions 2020 (in thousands) 2019 2021 Forecast 5838,242.70 $606,796.46 $231,446.24 9% growth 9% growth 769,030 556,694 212,336 166,328 705,499 503,727 201.772 151,267 Income Statement Total Revenue Cost of Revenue Gross Profit Operating Expenses Fixed Operating Expenses Variable Operations Exp. Depreciation Expense Total Operating Expenses Operating Profit Other Expenses Earnings Before Int. & Taxes Interest Expense Earnings Before Taxes Taxes Net Income Dividends Addition to Ret. Earnings Lowerby510 Grow by 9% Rise of $4th 9% grless 10 $83,154.00 590,648.76 $29,515.00 $203,317.76 $28,128.48 $2,399.00 $25,729.48 $3,797.00 $21,932.48 $7,237.72 $14,694.76 $5,000.00 $9,694.76 Add 54 thou. 29,511 195,839 16,497 2,399 14,098 3,793 10,305 3,414 $6,891.00 $0.00 $6,891.00 25,533 176,800 24,972 4593 20,379 3,044 17,335 5,864 $11,471.00 Not Given Not Given 2020 2019 Forecast Financial Ratios: 2021 Stored Liquidity 1.55 Current Ratio 0.24 Quick Ratio Industry Ave. 1.4 0.18 Assumptions Current Ratio Quick Ratio 1.47 0.16 1.41 0.12 2021 Forecast $13,795.26 $5,297.40 $102,037.08 $121,129.74 $195,034.00 $316,163.74 Balanceltem Grows 9% Grows 9% 2020 6,521 4,860 93,612 104.993 194998 299,991 2019 4,017 3,747 86,330 94,094 188,152 282.246 Given Balance Sheets Assets: Cash Accounts Receivables Inventory Total Current Assets Net PP&E Total Assets Liabilities & Equity: Accounts Payable Accrued Liabilities Total Current Liabilities Long-term Debt Total Debt Common Stock Retained Earnings Total Equity Total Liabs. & Equity Debt /Assets Debt/Equity LTD/Assets Times Int. Emed 2021 Solvency 54.59% Debt to TA 1.20 Debt to Equity 29.92% LTD to TA 6.78 TIE 2020 55.37% 1.24 31.52% 3.72 2019 55.10% 1.23 31.53% 6.69 Industry 60.00% 1.5 40.00% 8.31 Grows 996 Grows 9% $61,965.41 $16,036.08 $78,001.49 $94,584.49 $172,585.98 $55,037.00 $88,540.76 $143,577.76 $316,163.74 Plus 37.49 Given stays same PreRE-AddRE 56,849 14,712 71,561 94,547 166,108 55,037 78,846 133,883 299,991 53,615 12.926 66,541 88,980 155,521 54,770 71,955 126,725 282.246 Total S&U Average Industry 4.00% 3.54% CFO/Sales GrowthSales Days Inv. 2021 4.99% 9% 61.38 2.31 63.68 46.92 16.76 Cash Flow Liquidity CFO/Sales Growth Rate Sales Days Inventory Days Accts. Receivable Operating Cycle Days Days AP & Accruals Cash to Cash Days 60.00 2020 4.29% 9.01% 61.38 2.31 63.68 46.92 16.76 2019 4.10% 4.00% 62.55 1.94 64.49 48.22 16.28 Days AR OperCycleDays Days AP& Accr. CashtoCashDays 5.93 65.93 45.00 20.93 Forecast 2021 $14,694.76 $29,515.00 -5437.40 -$8,425.08 $5,116.41 $1,324.08 $41,787.77 2020 $6,891.00 $29,511.00 -1.113.00 -7.282.00 3,234.00 1,786.00 33,027.00 Profitability Ratios for the Dupont Analysis Below: Indirect Cash Flow Statement Net Income Depreciation Expense Less Rise in AR Less Rise in Inventory Plus Rise in AP Plus Rise in AL Net Cash Flow Operations Cash Used in Investing: Change in NPPE Plus Depreciation Expense Net Cash Used in Investing Cash from Financing Dividends Paid Rise in LT Debt Rise in Common Stock Cash from Financing: Change in Cash CFO less CFI plus CFF Check Change Cash $36.00 $29,515.00 $29,551.00 6,846 $29,511.00 $36,357.00 ROE ROA NPM GPM OPM AU FAT EM 2021 Profitability 2020 10.23% Return on Equity 5.15% 4.65% Return on Assets 2.30% 1.75% Net Profit Margin 0.90% 27.61% Gross Profit Margin 27.61% 3.36% Operating Profit Margin 2.15% 2.65 Asset Utilization 2.56 3.11 Fixed Asset Turnover 2.85 2.20 Equity Multiplier 2.24 2019 9.05% 4.06% 1.63% 28.60% 3.54% 2.50 2.68 2.23 Average Industry 16.36% 5.47% 1.78% 22.52% 2.78% 3.07 4.00 2.99 $5,000.00 $37.49 0 $4,962.51 0 5,567 267 $5,834.00 $7,274.26 $7,274.26 $2,504.00 2504 Eco Foods All statement in thousands Assumptions 2020 (in thousands) 2019 2021 Forecast 5838,242.70 $606,796.46 $231,446.24 9% growth 9% growth 769,030 556,694 212,336 166,328 705,499 503,727 201.772 151,267 Income Statement Total Revenue Cost of Revenue Gross Profit Operating Expenses Fixed Operating Expenses Variable Operations Exp. Depreciation Expense Total Operating Expenses Operating Profit Other Expenses Earnings Before Int. & Taxes Interest Expense Earnings Before Taxes Taxes Net Income Dividends Addition to Ret. Earnings Lowerby510 Grow by 9% Rise of $4th 9% grless 10 $83,154.00 590,648.76 $29,515.00 $203,317.76 $28,128.48 $2,399.00 $25,729.48 $3,797.00 $21,932.48 $7,237.72 $14,694.76 $5,000.00 $9,694.76 Add 54 thou. 29,511 195,839 16,497 2,399 14,098 3,793 10,305 3,414 $6,891.00 $0.00 $6,891.00 25,533 176,800 24,972 4593 20,379 3,044 17,335 5,864 $11,471.00 Not Given Not Given 2020 2019 Forecast Financial Ratios: 2021 Stored Liquidity 1.55 Current Ratio 0.24 Quick Ratio Industry Ave. 1.4 0.18 Assumptions Current Ratio Quick Ratio 1.47 0.16 1.41 0.12 2021 Forecast $13,795.26 $5,297.40 $102,037.08 $121,129.74 $195,034.00 $316,163.74 Balanceltem Grows 9% Grows 9% 2020 6,521 4,860 93,612 104.993 194998 299,991 2019 4,017 3,747 86,330 94,094 188,152 282.246 Given Balance Sheets Assets: Cash Accounts Receivables Inventory Total Current Assets Net PP&E Total Assets Liabilities & Equity: Accounts Payable Accrued Liabilities Total Current Liabilities Long-term Debt Total Debt Common Stock Retained Earnings Total Equity Total Liabs. & Equity Debt /Assets Debt/Equity LTD/Assets Times Int. Emed 2021 Solvency 54.59% Debt to TA 1.20 Debt to Equity 29.92% LTD to TA 6.78 TIE 2020 55.37% 1.24 31.52% 3.72 2019 55.10% 1.23 31.53% 6.69 Industry 60.00% 1.5 40.00% 8.31 Grows 996 Grows 9% $61,965.41 $16,036.08 $78,001.49 $94,584.49 $172,585.98 $55,037.00 $88,540.76 $143,577.76 $316,163.74 Plus 37.49 Given stays same PreRE-AddRE 56,849 14,712 71,561 94,547 166,108 55,037 78,846 133,883 299,991 53,615 12.926 66,541 88,980 155,521 54,770 71,955 126,725 282.246 Total S&U Average Industry 4.00% 3.54% CFO/Sales GrowthSales Days Inv. 2021 4.99% 9% 61.38 2.31 63.68 46.92 16.76 Cash Flow Liquidity CFO/Sales Growth Rate Sales Days Inventory Days Accts. Receivable Operating Cycle Days Days AP & Accruals Cash to Cash Days 60.00 2020 4.29% 9.01% 61.38 2.31 63.68 46.92 16.76 2019 4.10% 4.00% 62.55 1.94 64.49 48.22 16.28 Days AR OperCycleDays Days AP& Accr. CashtoCashDays 5.93 65.93 45.00 20.93 Forecast 2021 $14,694.76 $29,515.00 -5437.40 -$8,425.08 $5,116.41 $1,324.08 $41,787.77 2020 $6,891.00 $29,511.00 -1.113.00 -7.282.00 3,234.00 1,786.00 33,027.00 Profitability Ratios for the Dupont Analysis Below: Indirect Cash Flow Statement Net Income Depreciation Expense Less Rise in AR Less Rise in Inventory Plus Rise in AP Plus Rise in AL Net Cash Flow Operations Cash Used in Investing: Change in NPPE Plus Depreciation Expense Net Cash Used in Investing Cash from Financing Dividends Paid Rise in LT Debt Rise in Common Stock Cash from Financing: Change in Cash CFO less CFI plus CFF Check Change Cash $36.00 $29,515.00 $29,551.00 6,846 $29,511.00 $36,357.00 ROE ROA NPM GPM OPM AU FAT EM 2021 Profitability 2020 10.23% Return on Equity 5.15% 4.65% Return on Assets 2.30% 1.75% Net Profit Margin 0.90% 27.61% Gross Profit Margin 27.61% 3.36% Operating Profit Margin 2.15% 2.65 Asset Utilization 2.56 3.11 Fixed Asset Turnover 2.85 2.20 Equity Multiplier 2.24 2019 9.05% 4.06% 1.63% 28.60% 3.54% 2.50 2.68 2.23 Average Industry 16.36% 5.47% 1.78% 22.52% 2.78% 3.07 4.00 2.99 $5,000.00 $37.49 0 $4,962.51 0 5,567 267 $5,834.00 $7,274.26 $7,274.26 $2,504.00 2504
Step by Step Solution
There are 3 Steps involved in it
Step: 1

Get Instant Access to Expert-Tailored Solutions
See step-by-step solutions with expert insights and AI powered tools for academic success
Step: 2

Step: 3
Ace Your Homework with AI
Get the answers you need in no time with our AI-driven, step-by-step assistance
Get Started
Bitcoin Cash What You Need To Know About Bch
Authors: Alexander O. M.
1st Edition
1976721229, 978-1976721229