Question
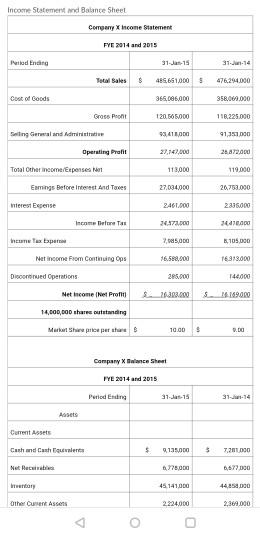
Part 3. Classify, calculate, and assess a) Liquidity and Turnover management of Current Assets and Liabilities, b) Profitability, and c) Market Value ratios. Please note
Part 3. Classify, calculate, and assess a) Liquidity and Turnover management of Current Assets and Liabilities, b) Profitability, and c) Market Value ratios. Please note outcomes as a multiple, percent, or dollar value.
Liquidity and Turnover management of Current Assets and Liabilities
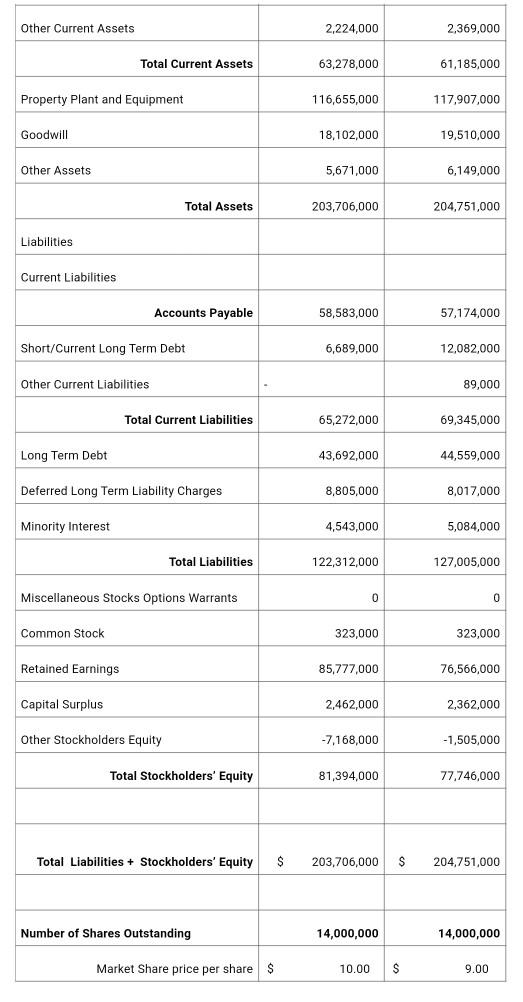
In this section, properly classify which of the above (from Part 2) are the liquidity and turnover ratios. Then, using the data from the Income Statement and Balance Sheet, provide the correct calculation of these four liquidity and turnover ratios and an assessment of the companys ability to maintain liquidity and the management of current assets and current liabilities.
Include the proper assessment of outcomes as positive or negative trends when all four ratio outcomes are factored as a group.
b. Profitability
In this section, properly classify which of the above (from Part 2) are the profitability ratios. Then, using the data from the Income Statement and Balance Sheet, provide the correct calculation of these four profitability ratios and an assessment of the companys ability to maintain if not improve profitability based on the amounts of Equity, Assets, and levels of profits from Sales. Include the proper assessment of outcomes as positive or negative trends when all four ratio outcomes are factored as a group.
c. Market Value
In this section, use the price per share data, the Income Statement and Balance Sheet to provide the correct calculation these two Market Value ratios; Earnings per Share (EPS) and Price to Earnings (P/E) ratio.
Given the changes of EPS from one year to the next, what is your assessment of the company's net income theoretically available for payment for investors holding common stock? As an investor to what extent are you more or less confident of the companys ability to add value to your ownership position?
Based on the companys P/E ratio changes from one year to the next what might this tell us about either investor sentiments of future profits, or stock price/value given the ability to generate income at a set price?


please answer with clarity. thank you.
Income Statement ad Balance Sheet Corony Xcome Statement FYE 2014 and 2015 Pero nang 31-1 31-14 Total Bales $ 485.661.000 5 476,294.000 Cost of Goods 366.095,000 358.069.000 120.565.000 116.225.000 93,411,000 91,35100 27,141.000 24.472.000 Gross Pront Selling Gerald Adre Operating Palit Total Other income/Expenses Eemings Before Interest And Toes interest Expense 113,000 119.000 27.034.000 26703,000 2461.000 2335.000 Income Delore Tat 24372,000 34410.000 ne tape 7,105,000 105.000 16.589,000 16.913.000 285.000 144.000 Net income From Continuing Discontinued Operations Net Income et Profil 14,000,000 share buting Mark Sheepers 20303.00 10.00 $ 0.00 Company Bence Sheet FYE 2014 and 2015 Period Ending 31-15 3116 Aset Current Assets Cash and Cashouler $ 9.135.000 3 7.261 000 77000 6677 000 45.141.000 4425.DOO Other Current Assets 2.224.000 2,369.000 Other Current Assets 2,224,000 2,369,000 Total Current Assets 63,278,000 61,185,000 Property Plant and Equipment 116,655,000 117,907,000 Goodwill 18,102,000 19,510,000 Other Assets 5,671,000 6,149,000 Total Assets 203,706,000 204,751,000 Liabilities Current Liabilities Accounts Payable 58,583,000 57,174,000 Short/Current Long Term Debt 6,689,000 12,082,000 Other Current Liabilities 89,000 Total Current Liabilities 65,272,000 69,345,000 Long Term Debt 43,692,000 44,559,000 Deferred Long Term Liability Charges 8,805,000 8,017,000 Minority Interest 4,543,000 5,084,000 Total Liabilities 122,312,000 127,005,000 Miscellaneous Stocks Options Warrants 0 0 Common Stock 323,000 323,000 Retained Earnings 85,777,000 76,566,000 Capital Surplus 2,462,000 2,362,000 Other Stockholders Equity -7,168,000 -1,505,000 Total Stockholders' Equity 81,394,000 77,746,000 Total Liabilities + Stockholders' Equity $ 203,706,000 $ 204,751,000 Number of Shares Outstanding 14,000,000 14,000,000 Market Share price per share $ 10.00 $ 9.00 Income Statement ad Balance Sheet Corony Xcome Statement FYE 2014 and 2015 Pero nang 31-1 31-14 Total Bales $ 485.661.000 5 476,294.000 Cost of Goods 366.095,000 358.069.000 120.565.000 116.225.000 93,411,000 91,35100 27,141.000 24.472.000 Gross Pront Selling Gerald Adre Operating Palit Total Other income/Expenses Eemings Before Interest And Toes interest Expense 113,000 119.000 27.034.000 26703,000 2461.000 2335.000 Income Delore Tat 24372,000 34410.000 ne tape 7,105,000 105.000 16.589,000 16.913.000 285.000 144.000 Net income From Continuing Discontinued Operations Net Income et Profil 14,000,000 share buting Mark Sheepers 20303.00 10.00 $ 0.00 Company Bence Sheet FYE 2014 and 2015 Period Ending 31-15 3116 Aset Current Assets Cash and Cashouler $ 9.135.000 3 7.261 000 77000 6677 000 45.141.000 4425.DOO Other Current Assets 2.224.000 2,369.000 Other Current Assets 2,224,000 2,369,000 Total Current Assets 63,278,000 61,185,000 Property Plant and Equipment 116,655,000 117,907,000 Goodwill 18,102,000 19,510,000 Other Assets 5,671,000 6,149,000 Total Assets 203,706,000 204,751,000 Liabilities Current Liabilities Accounts Payable 58,583,000 57,174,000 Short/Current Long Term Debt 6,689,000 12,082,000 Other Current Liabilities 89,000 Total Current Liabilities 65,272,000 69,345,000 Long Term Debt 43,692,000 44,559,000 Deferred Long Term Liability Charges 8,805,000 8,017,000 Minority Interest 4,543,000 5,084,000 Total Liabilities 122,312,000 127,005,000 Miscellaneous Stocks Options Warrants 0 0 Common Stock 323,000 323,000 Retained Earnings 85,777,000 76,566,000 Capital Surplus 2,462,000 2,362,000 Other Stockholders Equity -7,168,000 -1,505,000 Total Stockholders' Equity 81,394,000 77,746,000 Total Liabilities + Stockholders' Equity $ 203,706,000 $ 204,751,000 Number of Shares Outstanding 14,000,000 14,000,000 Market Share price per share $ 10.00 $ 9.00Step by Step Solution
There are 3 Steps involved in it
Step: 1

Get Instant Access to Expert-Tailored Solutions
See step-by-step solutions with expert insights and AI powered tools for academic success
Step: 2

Step: 3

Ace Your Homework with AI
Get the answers you need in no time with our AI-driven, step-by-step assistance
Get Started


