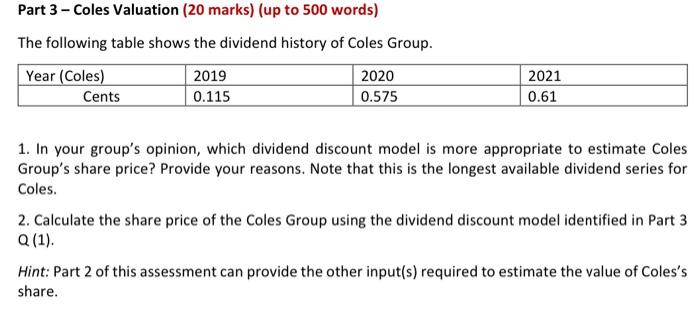
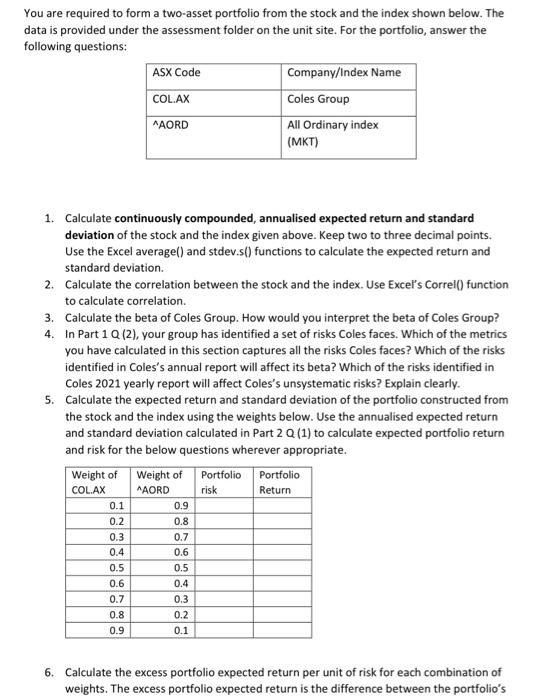
Part 3 - Coles Valuation (20 marks) (up to 500 words) The following table shows the dividend history of Coles Group. Year (Coles) 2019 2020 Cents 0.115 0.575 2021 0.61 1. In your group's opinion, which dividend discount model is more appropriate to estimate Coles Group's share price? Provide your reasons. Note that this is the longest available dividend series for Coles. 2. Calculate the share price of the Coles Group using the dividend discount model identified in Part 3 Q (1). Hint: Part 2 of this assessment can provide the other input(s) required to estimate the value of Coles's share. You are required to form a two-asset portfolio from the stock and the index shown below. The data is provided under the assessment folder on the unit site. For the portfolio, answer the following questions: ASX Code Company/Index Name COL.AX Coles Group AORD All Ordinary index (MKT) 1. Calculate continuously compounded, annualised expected return and standard deviation of the stock and the index given above. Keep two to three decimal points. Use the Excel average() and stdev.s() functions to calculate the expected return and standard deviation. 2. Calculate the correlation between the stock and the index. Use Excel's Correl() function to calculate correlation. 3. Calculate the beta of Coles Group. How would you interpret the beta of Coles Group? 4. In Part 1 Q (2), your group has identified a set of risks Coles faces. Which of the metrics you have calculated in this section captures all the risks Coles faces? Which of the risks identified in Coles's annual report will affect its beta? Which of the risks identified in Coles 2021 yearly report will affect Coles's unsystematic risks? Explain clearly. 5. Calculate the expected return and standard deviation of the portfolio constructed from the stock and the index using the weights below. Use the annualised expected return and standard deviation calculated in Part 2 Q (1) to calculate expected portfolio return and risk for the below questions wherever appropriate. Weight of Weight of Portfolio Portfolio risk Return COL.AX 0.1 0.2 0.3 0.4 0.5 0.6 0.7 0.8 0.9 AAORD 0.9 0.8 0.7 0.6 0.5 0.4 0.3 0.2 0.1 6. Calculate the excess portfolio expected return per unit of risk for each combination of weights. The excess portfolio expected return is the difference between the portfolio's expected return and the risk-free rate. Assume the risk-free rate is 2%. The risk-free rate is the current 10-year Australian government bond coupon rate. Explain your answer clearly and show your workings. 7. Use Excel's Solver function to find the combination of weights of stock and the index that maximises excess portfolio expected return per unit of risk. 8. Calculate the expected return of Coles's share using the Capital Asset Pricing Model. Assume the risk-free rate is 2%


