

Answered step by step
Verified Expert Solution
Question
1 Approved Answer
Part 3: Financial Ratios Review (32 marks) The following table presents the data for Can Do Inc. as of December 31, 2018: Accounts payable Accounts
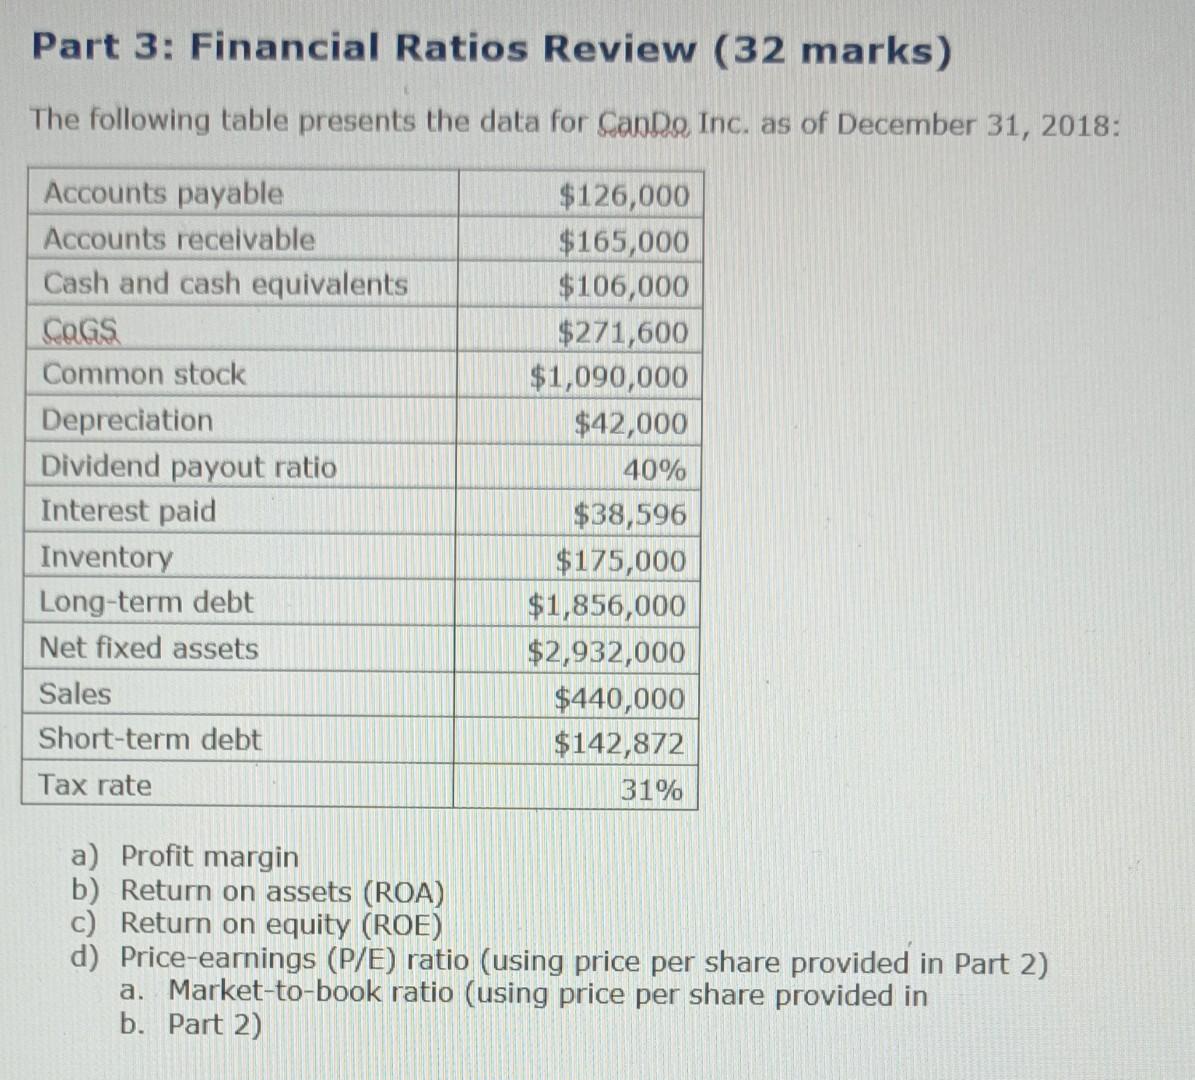
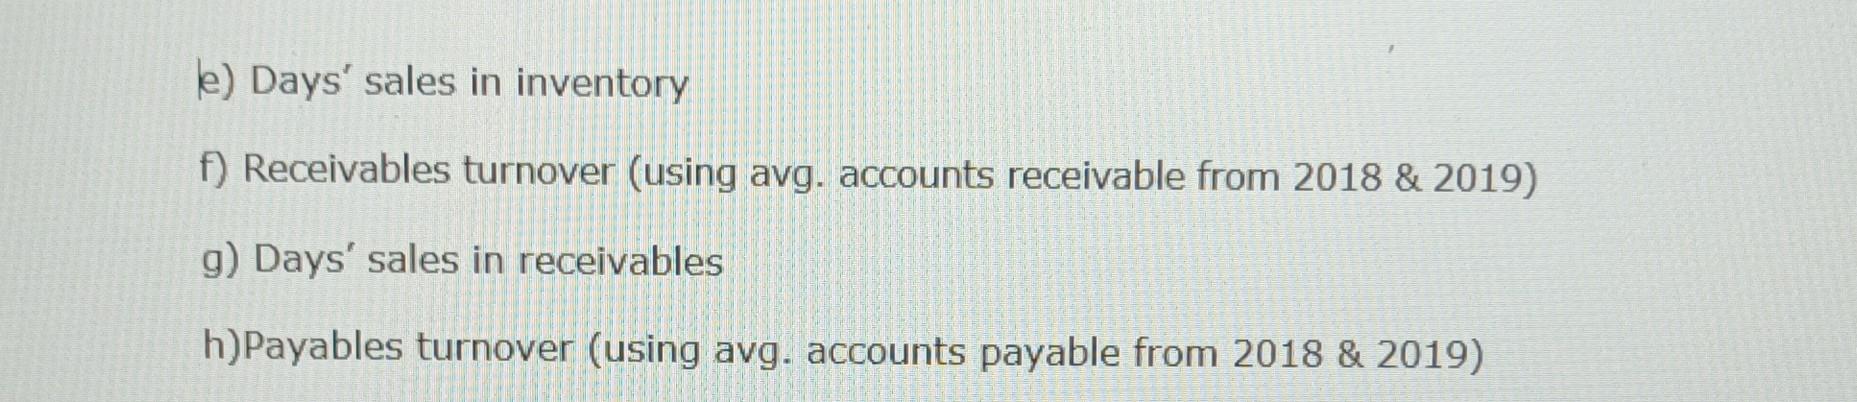
Part 3: Financial Ratios Review (32 marks) The following table presents the data for Can Do Inc. as of December 31, 2018: Accounts payable Accounts receivable Cash and cash equivalents CaGs Common stock Depreciation Dividend payout ratio Interest paid Inventory Long-term debt Net fixed assets Sales Short-term debt Tax rate $126,000 $165,000 $106,000 $271,600 $1,090,000 $42,000 40% $38,596 $175,000 $1,856,000 $2,932,000 $440,000 $142,872 31% a) Profit margin b) Return on assets (ROA) c) Return on equity (ROE) d) Price-earnings (P/E) ratio (using price per share provided in Part 2) a. Market-to-book ratio (using price per share provided in b. Part 2) e) Days' sales in inventory f) Receivables turnover (using avg. accounts receivable from 2018 & 2019) g) Days' sales in receivables h) Payables turnover (using avg. accounts payable from 2018 & 2019)
Step by Step Solution
There are 3 Steps involved in it
Step: 1

Get Instant Access to Expert-Tailored Solutions
See step-by-step solutions with expert insights and AI powered tools for academic success
Step: 2

Step: 3
Ace Your Homework with AI
Get the answers you need in no time with our AI-driven, step-by-step assistance
Get Started
Fundamentals of Financial Management
Authors: Eugene F. Brigham, Joel F. Houston
15th edition
1337671002, 978-1337395250