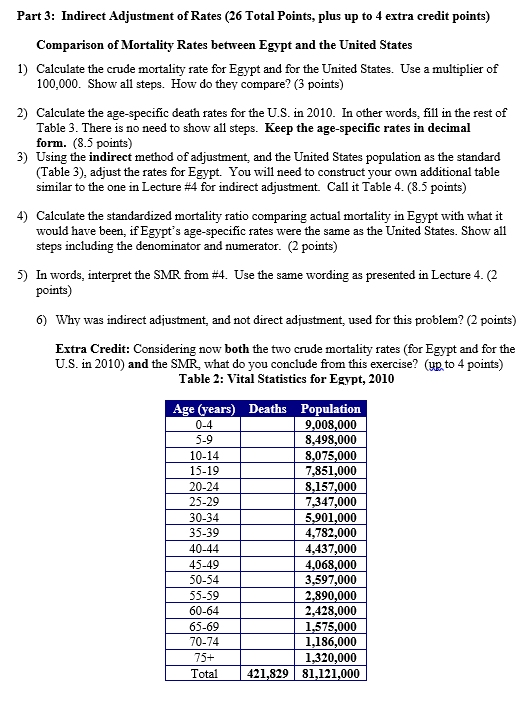
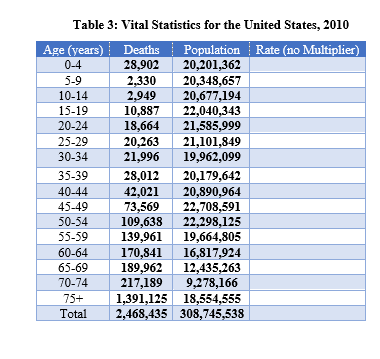
Part 3: Indirect Adjustment of Rates (26 Total Points, plus up to 4 extra credit points) Comparison of Mortality Rates between Egypt and the United States 1) Calculate the crude mortality rate for Egypt and for the United States. Use a multiplier of 100,000. Show all steps. How do they compare? (3 points) 2) Calculate the age-specific death rates for the U.S. in 2010. In other words, fill in the rest of Table 3. There is no need to show all steps. Keep the age-specific rates in decimal form. (8.5 points) 3) Using the indirect method of adjustment, and the United States population as the standard (Table 3), adjust the rates for Egypt. You will need to construct your own additional table similar to the one in Lecture #4 for indirect adjustment. Call it Table 4. (3.5 points) 4) Calculate the standardized mortality ratio comparing actual mortality in Egypt with what it would have been, if Egypt's age-specific rates were the same as the United States. Show all steps including the denominator and numerator. (2 points) 5) In words, interpret the SMR from #4. Use the same wording as presented in Lecture 4. (2 points) 6) Why was indirect adjustment, and not direct adjustment, used for this problem? (2 points) Extra Credit: Considering now both the two crude mortality rates (for Egypt and for the U.S. in 2010) and the SMR, what do you conclude from this exercise? (up to 4 points) Table 2: Vital Statistics for Egypt, 2010 Age (years) Deaths Population 0-4 9,008,000 5-9 8,498,000 10-14 8,075,000 15-19 7,851,000 20-24 8.157,000 25-29 7,347,000 30-34 5,901,000 35-39 4,782,000 40-44 4,437,000 45-49 4,068,000 50-54 3,597,000 55-59 2.890,000 60-64 2,428,000 65-69 1,575,000 70-74 1,186,000 75+ 1,320,000 Total 421,829 81,121,000 Table 3: Vital Statistics for the United States, 2010 Age (years) Deaths Population Rate (no Multiplier) 0-4 28,902 20,201,362 5-9 2,330 20,348,657 10-14 2.949 20,677,194 15-19 10,887 22,040,343 20-24 18,664 21,585,999 25-29 20,263 21,101,849 30-34 21,996 19,962,099 35-39 28,012 20,179,642 40-44 42,021 20,890,964 45-49 73,569 22,708,591 50-54 109,638 22,298,125 55-59 139,961 19,664,805 60-64 170,841 16,817,924 65-69 189,962 12,435,263 70-74 217,189 9,278,166 75+ 1,391,125 18,554,555 Total 2,468,435 308,745,538 Part 3: Indirect Adjustment of Rates (26 Total Points, plus up to 4 extra credit points) Comparison of Mortality Rates between Egypt and the United States 1) Calculate the crude mortality rate for Egypt and for the United States. Use a multiplier of 100,000. Show all steps. How do they compare? (3 points) 2) Calculate the age-specific death rates for the U.S. in 2010. In other words, fill in the rest of Table 3. There is no need to show all steps. Keep the age-specific rates in decimal form. (8.5 points) 3) Using the indirect method of adjustment, and the United States population as the standard (Table 3), adjust the rates for Egypt. You will need to construct your own additional table similar to the one in Lecture #4 for indirect adjustment. Call it Table 4. (3.5 points) 4) Calculate the standardized mortality ratio comparing actual mortality in Egypt with what it would have been, if Egypt's age-specific rates were the same as the United States. Show all steps including the denominator and numerator. (2 points) 5) In words, interpret the SMR from #4. Use the same wording as presented in Lecture 4. (2 points) 6) Why was indirect adjustment, and not direct adjustment, used for this problem? (2 points) Extra Credit: Considering now both the two crude mortality rates (for Egypt and for the U.S. in 2010) and the SMR, what do you conclude from this exercise? (up to 4 points) Table 2: Vital Statistics for Egypt, 2010 Age (years) Deaths Population 0-4 9,008,000 5-9 8,498,000 10-14 8,075,000 15-19 7,851,000 20-24 8.157,000 25-29 7,347,000 30-34 5,901,000 35-39 4,782,000 40-44 4,437,000 45-49 4,068,000 50-54 3,597,000 55-59 2.890,000 60-64 2,428,000 65-69 1,575,000 70-74 1,186,000 75+ 1,320,000 Total 421,829 81,121,000 Table 3: Vital Statistics for the United States, 2010 Age (years) Deaths Population Rate (no Multiplier) 0-4 28,902 20,201,362 5-9 2,330 20,348,657 10-14 2.949 20,677,194 15-19 10,887 22,040,343 20-24 18,664 21,585,999 25-29 20,263 21,101,849 30-34 21,996 19,962,099 35-39 28,012 20,179,642 40-44 42,021 20,890,964 45-49 73,569 22,708,591 50-54 109,638 22,298,125 55-59 139,961 19,664,805 60-64 170,841 16,817,924 65-69 189,962 12,435,263 70-74 217,189 9,278,166 75+ 1,391,125 18,554,555 Total 2,468,435 308,745,538