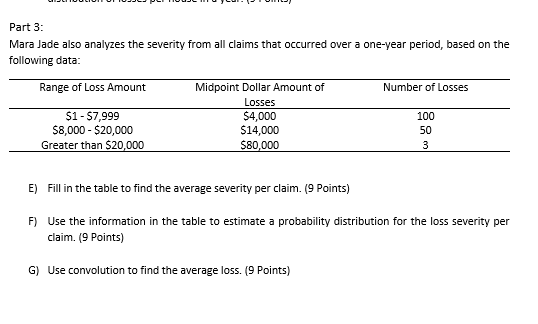
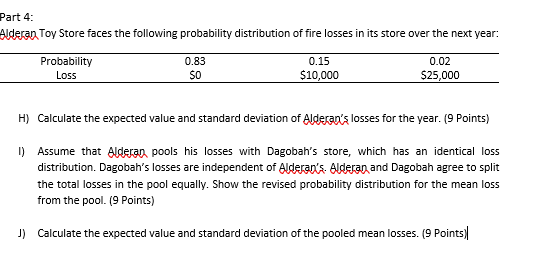
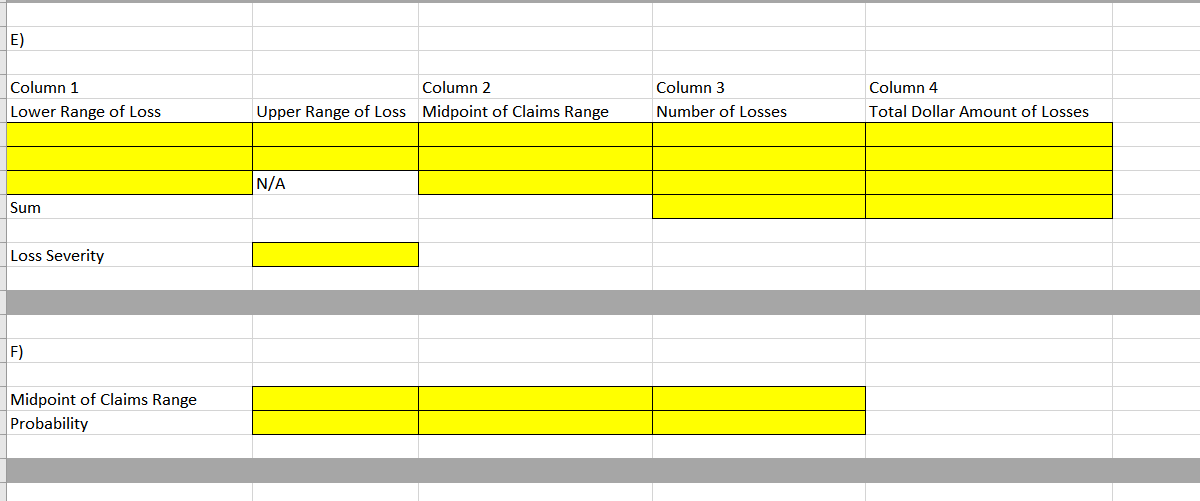
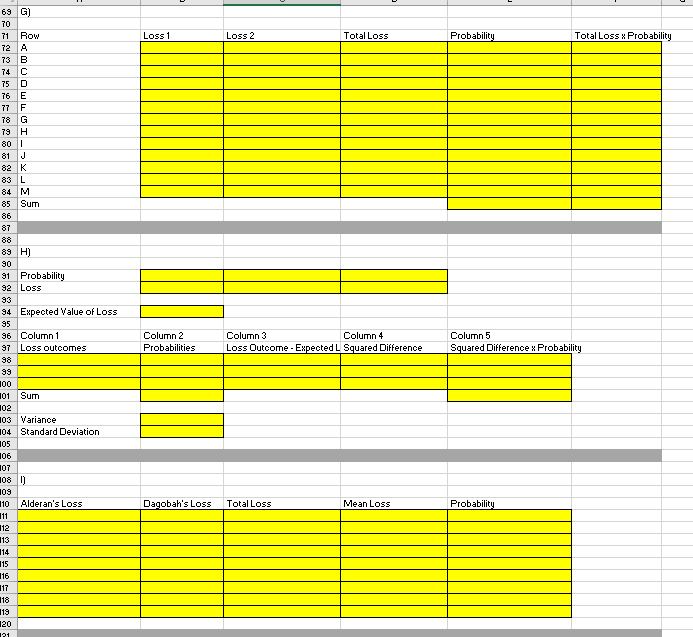
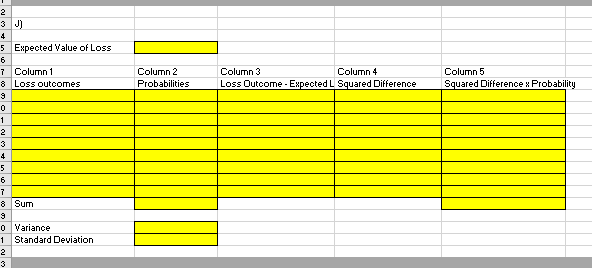
Part 3: Mara Jade also analyzes the severity from all claims that occurred over a one-year period, based on the following data: Range of Loss Amount Midpoint Dollar Amount of Number of Losses Losses $1 - 57,999 $4,000 100 $8,000 - $20,000 $14,000 50 Greater than $20,000 $80,000 3 E) Fill in the table to find the average severity per claim. (9 Points) F) Use the information in the table to estimate a probability distribution for the loss severity per claim. (9 Points) G) Use convolution to find the average loss. (9 Points) Part 4 Alderan Toy Store faces the following probability distribution of fire losses in its store over the next year: Probability Loss 0.83 SO 0.15 $10,000 0.02 $25,000 H) Calculate the expected value and standard deviation of Alderan's losses for the year. (9 Points) 1) Assume that Alderan pools his losses with Dagobah's store, which has an identical loss distribution. Dagobah's losses are independent of Alderan's Alderan and Dagobah agree to split the total losses in the pool equally. Show the revised probability distribution for the mean loss from the pool. (9 Points) J) Calculate the expected value and standard deviation of the pooled mean losses. (9 points) E) Column 1 Lower Range of Loss Column 2 Upper Range of Loss Midpoint of Claims Range Column 3 Number of Losses Column 4 Total Dollar Amount of Losses N/A Sum Loss Severity F) Midpoint of Claims Range Probability Loss 1 Loss 2 Total Loss Probability Total Loss x Probability 69 G) 70 71 Row 72 A 73 74 75 76 77 78 79 801 81 J 82 K 83 L 84 M 85 Sum 86 87 a COWLGI 89 H) 90 91 Probability 92 Loss Column 2 Probabilities Column 3 Column 4 Loss Outcome - Expected L Squared Difference Column 5 Squared Difference x Probability 94 Expected Value of Loss 95 96 Column 1 97 Loss outcomes 98 99 100 101 Sum 102 103 Variance 104 Standard Deviation 105 106 107 108 1) 109 110 Alderan's Loss 111 112 113 114 115 116 117 118 119 120 21 Dagobah's Loss Total Loss Mean Loss Probability Column 2 Probabilities Column 3 Column 4 Loss Outcome - Expected L Squared Difference Column 5 Squared Difference x Probability 2 3 J) 4 5 Expected Value of Loss 6 7 Column 1 8 Loss outcomes 9 0 1 2 3 4 5 6 7 8 Sum 9 0 Variance 1 Standard Deviation 2 Part 3: Mara Jade also analyzes the severity from all claims that occurred over a one-year period, based on the following data: Range of Loss Amount Midpoint Dollar Amount of Number of Losses Losses $1 - 57,999 $4,000 100 $8,000 - $20,000 $14,000 50 Greater than $20,000 $80,000 3 E) Fill in the table to find the average severity per claim. (9 Points) F) Use the information in the table to estimate a probability distribution for the loss severity per claim. (9 Points) G) Use convolution to find the average loss. (9 Points) Part 4 Alderan Toy Store faces the following probability distribution of fire losses in its store over the next year: Probability Loss 0.83 SO 0.15 $10,000 0.02 $25,000 H) Calculate the expected value and standard deviation of Alderan's losses for the year. (9 Points) 1) Assume that Alderan pools his losses with Dagobah's store, which has an identical loss distribution. Dagobah's losses are independent of Alderan's Alderan and Dagobah agree to split the total losses in the pool equally. Show the revised probability distribution for the mean loss from the pool. (9 Points) J) Calculate the expected value and standard deviation of the pooled mean losses. (9 points) E) Column 1 Lower Range of Loss Column 2 Upper Range of Loss Midpoint of Claims Range Column 3 Number of Losses Column 4 Total Dollar Amount of Losses N/A Sum Loss Severity F) Midpoint of Claims Range Probability Loss 1 Loss 2 Total Loss Probability Total Loss x Probability 69 G) 70 71 Row 72 A 73 74 75 76 77 78 79 801 81 J 82 K 83 L 84 M 85 Sum 86 87 a COWLGI 89 H) 90 91 Probability 92 Loss Column 2 Probabilities Column 3 Column 4 Loss Outcome - Expected L Squared Difference Column 5 Squared Difference x Probability 94 Expected Value of Loss 95 96 Column 1 97 Loss outcomes 98 99 100 101 Sum 102 103 Variance 104 Standard Deviation 105 106 107 108 1) 109 110 Alderan's Loss 111 112 113 114 115 116 117 118 119 120 21 Dagobah's Loss Total Loss Mean Loss Probability Column 2 Probabilities Column 3 Column 4 Loss Outcome - Expected L Squared Difference Column 5 Squared Difference x Probability 2 3 J) 4 5 Expected Value of Loss 6 7 Column 1 8 Loss outcomes 9 0 1 2 3 4 5 6 7 8 Sum 9 0 Variance 1 Standard Deviation 2