Question
Part 3 Requirements : During 2016, the following key events occurred at TECHNOGYM. Discontinued Operation : On October 1, 2015, TECHNOGYM made and announced a
Part 3 Requirements:
During 2016, the following key events occurred at TECHNOGYM.
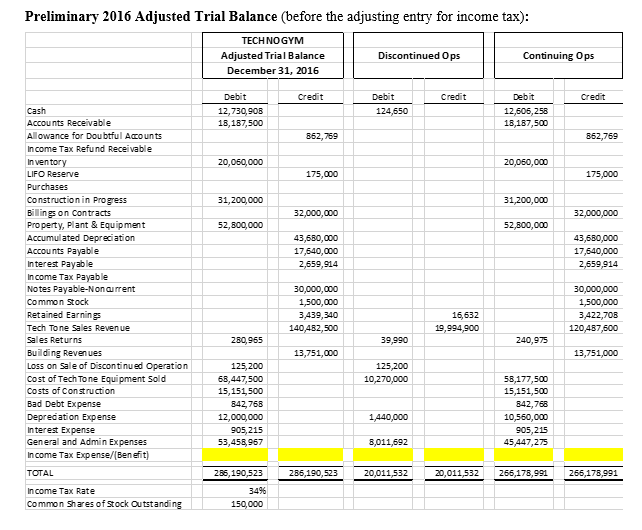
Discontinued Operation: On October 1, 2015, TECHNOGYM made and announced a decision to sell its West Coast operations (considered a component according to the GAAP definition) to an unaffiliated company. On December 31, 2016, the West Coast division was sold, and the actual result of the sale was a $125,200 loss. The journal entries related to the sale were recorded already, along with all other normal 2016 adjusting entries.
Revenue Recognition: TECHNOGYM has a division that builds university fitness centers. At the end of 2016, there was one building project in process, the $45,000,000 Western Sky University project (WSU), which was started in June 2015. Throughout 2016, routine transaction entries were to record construction costs, billings, and collections. During 2016 there were substantial additional cost increases, resulting in a 2016 year-end total cost estimate of $45,500,000 for the job.
Accounts Receivable: TECHNOGYM uses the Accounts Receivable approach to estimate bad debts, based on an A/R aging schedule.
g. Mr. James Techno, the companys President, has asked you to prepare a brief memo for him, which should include following three key items:
1) Analyze TECHNOGYMs 2016 financial statements, identifying the major factors causing changes in the companys financial health and performance.
Recommendation: Look at the data behind the financial statements and the relationships among the values. It is always a good idea to start with a horizontal (changes year to year) and vertical (percentage of assets, revenues) analyses to assess which values changed the most significantly so you can consider the possible causes and decisions. For example:
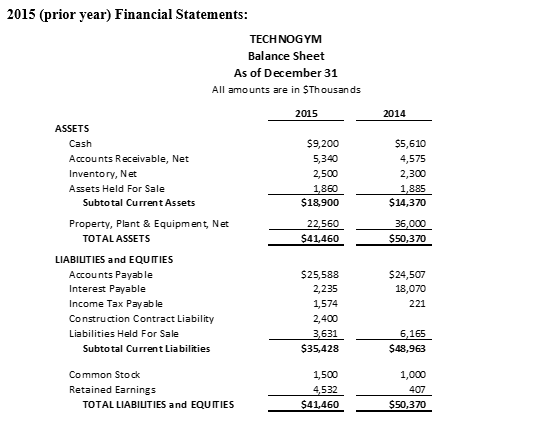
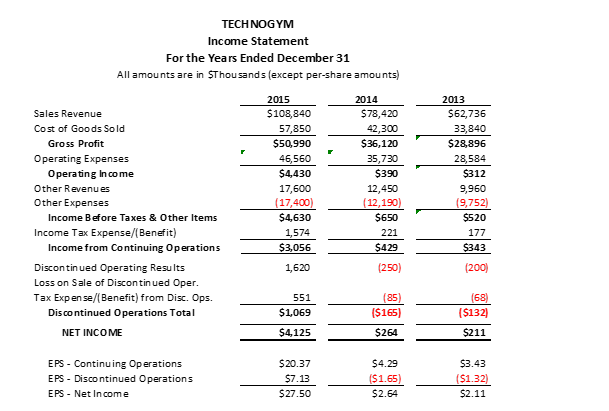
Horizontal Analysis for 2015: from 2014 to 2015 Cash changed from $5,610 to $9,200an increase of $3,590 (64%); Accounts Receivable, net changed from $4,575 to $5,340an increase of $765 (17%).
Vertical Analysis for 2015: Inventory was 6% of Total Assets (2,500/41,460); Cost of Goods Sold was 53% of Revenue (57,850/108,840).
How did the various business segments perform against expectations? Think about the related accounts and the journal entries that would be made for the changes. For example, if product sales increase, normally so would A/R, bad debts, COGS, and sometimes inventory and accounts payable (if continued growth is expected). Does the timing of purchases and sales imply anything?
2) Analyze the following applicable ratios:
|
| 2016 Ratio Values | 2015 Ratio Values |
| Current Ratio | 2.3 | 0.5 |
| Quick Ratio | 1.4 | 0.4 |
| Debt-to-Assets Ratio | 0.9 | 0.9 |
| Times-Interest-Earned Ratio | 4.3 | n/a |
| Net Profit Margin Pct. | 1.7 | 3.8 |
| Return on Equity Pct. | 28.8 | 68.4 |
| Account Receivable Turnover | 10.6 | 22.0 |
| Inventory Turnover | 5.2 | 24.1 |
Select several ratios of different types (profitability, efficiency, liquidity, solvency) that provide the best insight into the companys financial performance and position.
Recommendation: Analysis is more than calculating a ratio and saying if it is good or bad. Dont just explain how the numbers changedexplain what they reveal about business decisions and events, and what they might mean for the future. Think about things like: What were the big changes? What caused them? Are they reason for ongoing concern? How were complementary ratios impacted (e.g., if cash was obtained by issuing stock, current ratio would increase but return on equity would decrease)?
3) Provide specific recommendations for improvements.
Note: The 2015 Balance Sheet and 2015 Income Statement are attached to this document. Please include (as an attachment) a small table of the ratios you discuss in the memo. Top management understands the ratios so your explanation should not include definitions. Your explanation memo should be single spaced, and 1 to 1.5 pages in length (not counting the ratio table).


Step by Step Solution
There are 3 Steps involved in it
Step: 1

Get Instant Access to Expert-Tailored Solutions
See step-by-step solutions with expert insights and AI powered tools for academic success
Step: 2

Step: 3

Ace Your Homework with AI
Get the answers you need in no time with our AI-driven, step-by-step assistance
Get Started


