

Question
Part A: Estimate and interpret the correlation coefficient. (5 points) Part B: Create an outlier point for this graph that would cause the correlation to
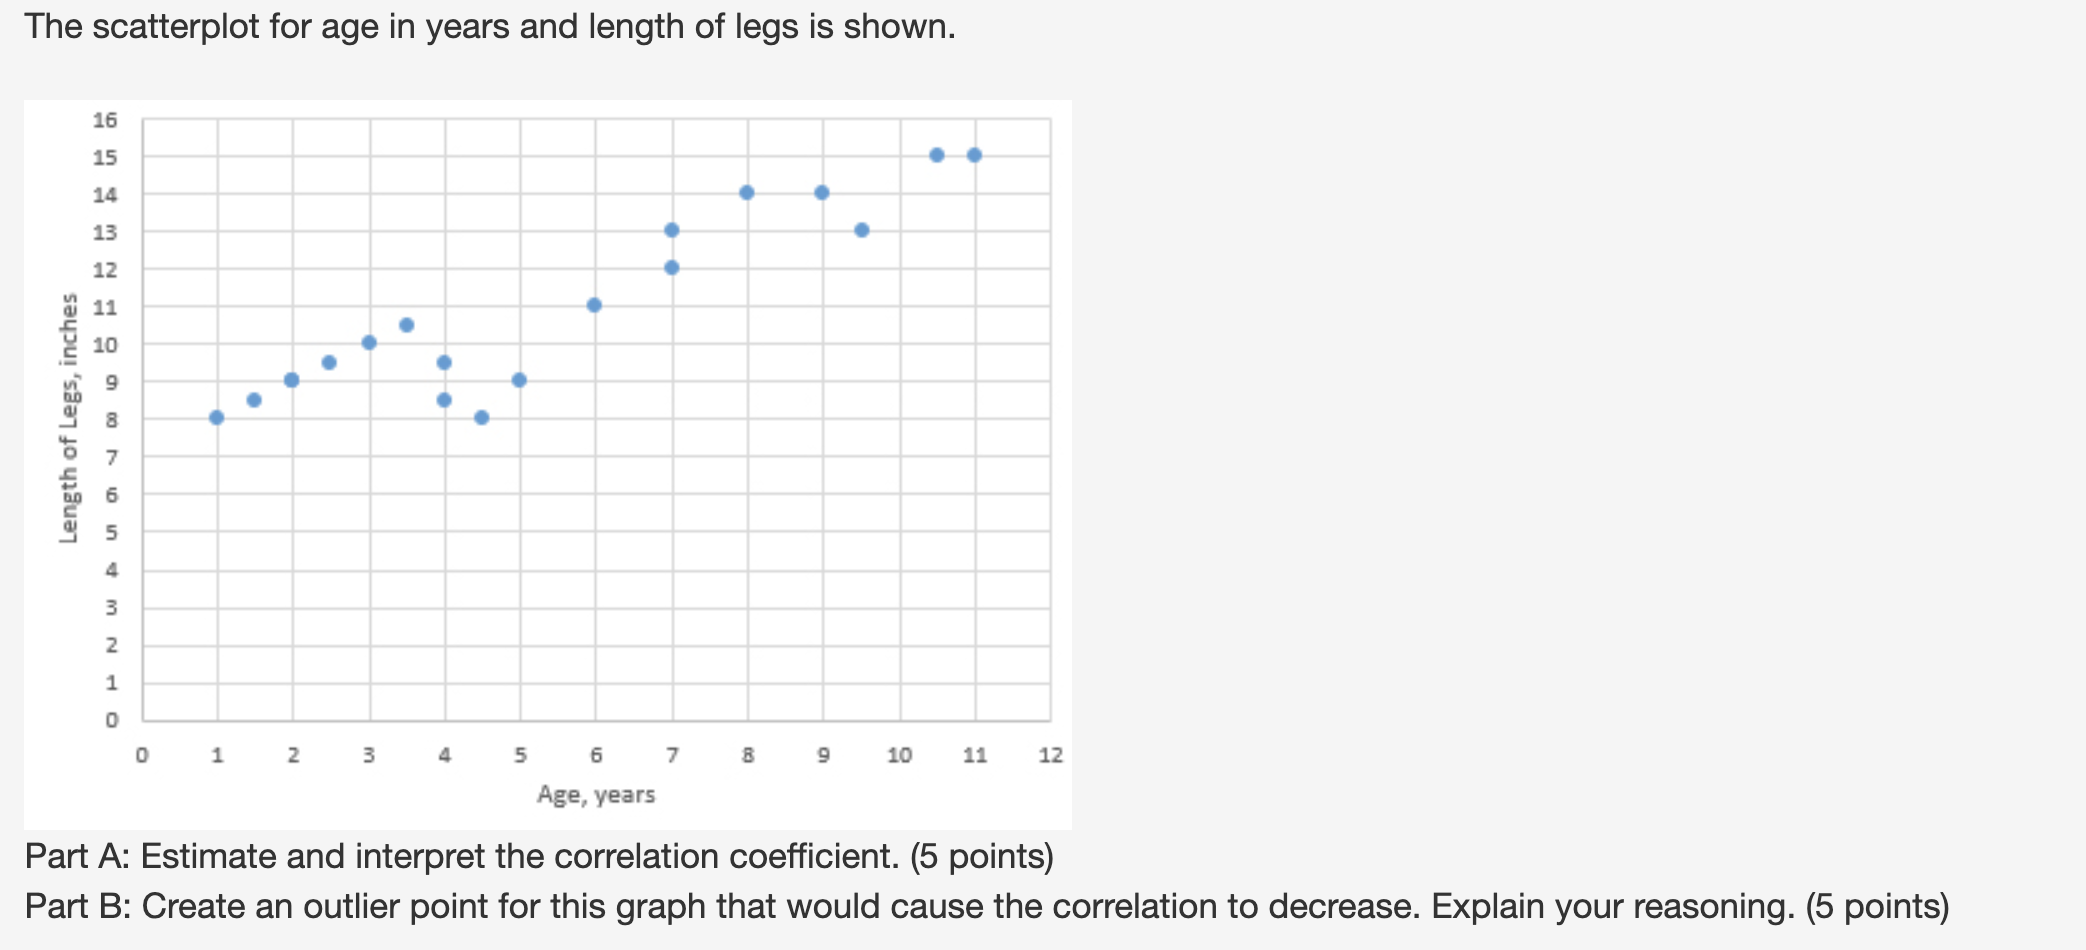
Part A: Estimate and interpret the correlation coefficient. (5 points)
Part B: Create an outlier point for this graph that would cause the correlation to decrease. Explain your reasoning. (5 points
Step by Step Solution
There are 3 Steps involved in it
Step: 1

Get Instant Access to Expert-Tailored Solutions
See step-by-step solutions with expert insights and AI powered tools for academic success
Step: 2

Step: 3
Ace Your Homework with AI
Get the answers you need in no time with our AI-driven, step-by-step assistance
Get Started
Calculus Early Transcendentals
Authors: William L. Briggs, Lyle Cochran, Bernard Gillett
2nd edition
321954428, 321954424, 978-0321947345