

Answered step by step
Verified Expert Solution
Question
1 Approved Answer
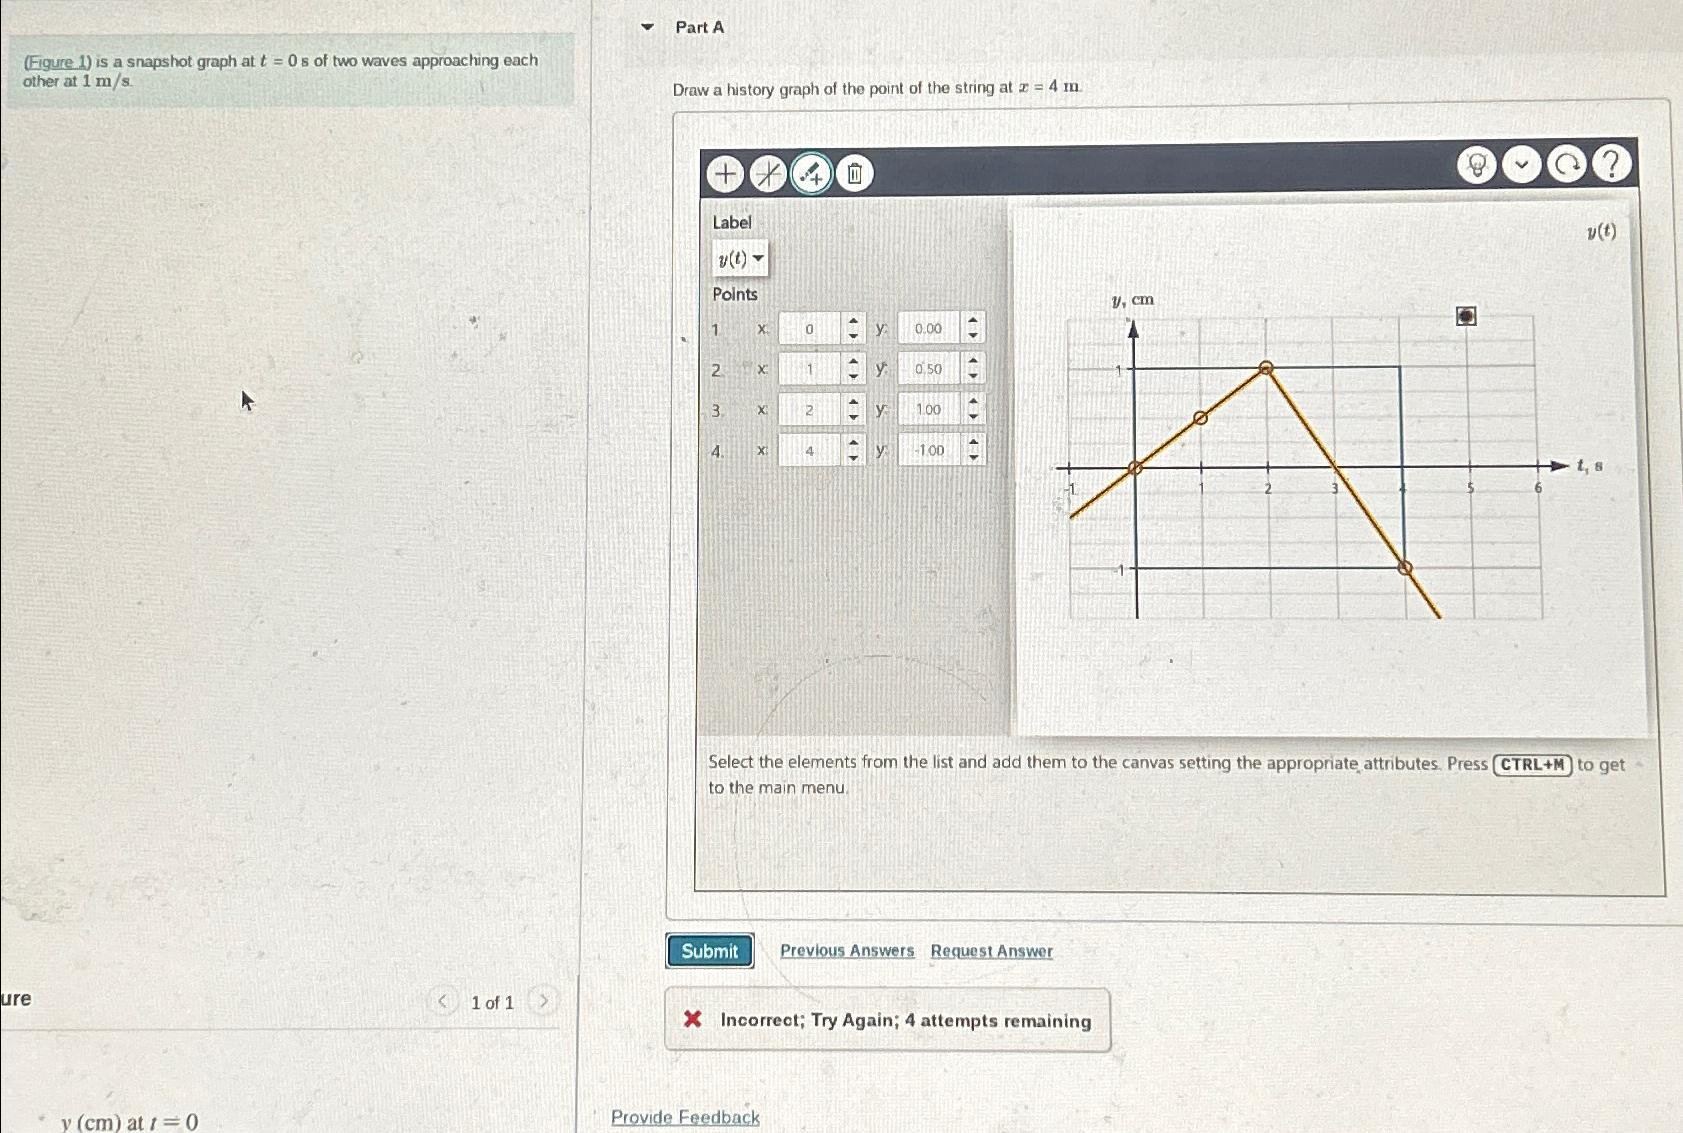
Part A ( Figure 1 ) is a snapshot graph at t = 0 s of two waves approaching each other at 1 m s
Part A
Figure is a snapshot graph at of two waves approaching each other at
Draw a history graph of the point of the string at
Previous Answers
Request Answer
of
at
Provide Feedback
Step by Step Solution
There are 3 Steps involved in it
Step: 1

Get Instant Access to Expert-Tailored Solutions
See step-by-step solutions with expert insights and AI powered tools for academic success
Step: 2

Step: 3
Ace Your Homework with AI
Get the answers you need in no time with our AI-driven, step-by-step assistance
Get Started
Public Finance
Authors: Harvey Rosen, Ted Gayer
10th Global Edition
007715469X, 978-0077154691