Answered step by step
Verified Expert Solution
Link Copied!

Question

1 Approved Answer

Part A (Figure 1) The figure shows a snapshot graph at t = 0 s of two wave pulses approaching each other at 1.0 m/s.

image text in transcribedimage text in transcribed
Part A (Figure 1) The figure shows a snapshot graph at t = 0 s of two wave pulses approaching each other at 1.0 m/s. At what time was the snapshot graph (Figure 2), showing the superposition of the two pulses, taken? (Click on the "figure" if the graph does n appear.) Express your answer to two significant figures and include the appropriate units. t = 2.5 Submit Previous Answers Request Answer X Incorrect; Try Again; 8 attempts remaining Provide Feedback Next > Figure 1 of 2 (> D (cm) at f = 0 s 1.0 m/s x (m) 0 2 4 8 10 1.0 m/s

Step by Step Solution

There are 3 Steps involved in it

Step: 1

blur-text-image

Get Instant Access to Expert-Tailored Solutions

See step-by-step solutions with expert insights and AI powered tools for academic success

Step: 2

blur-text-image

Step: 3

blur-text-image

Ace Your Homework with AI

Get the answers you need in no time with our AI-driven, step-by-step assistance

Get Started

Recommended Textbook for

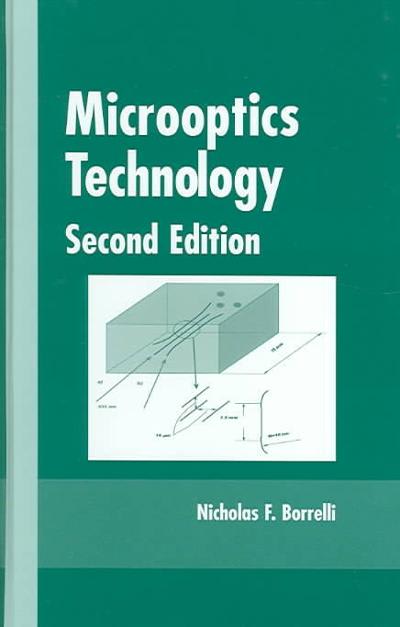
Microoptics Technology Fabrication And Applications Of Lens Arrays And Devices

Authors: Nicholas F Borrelli

2nd Edition

1351836668, 9781351836661

More Books

Students also viewed these Physics questions

Question

Find Ln z when z equals ei

Answered: 1 week ago