Answered step by step
Verified Expert Solution
Question
1 Approved Answer
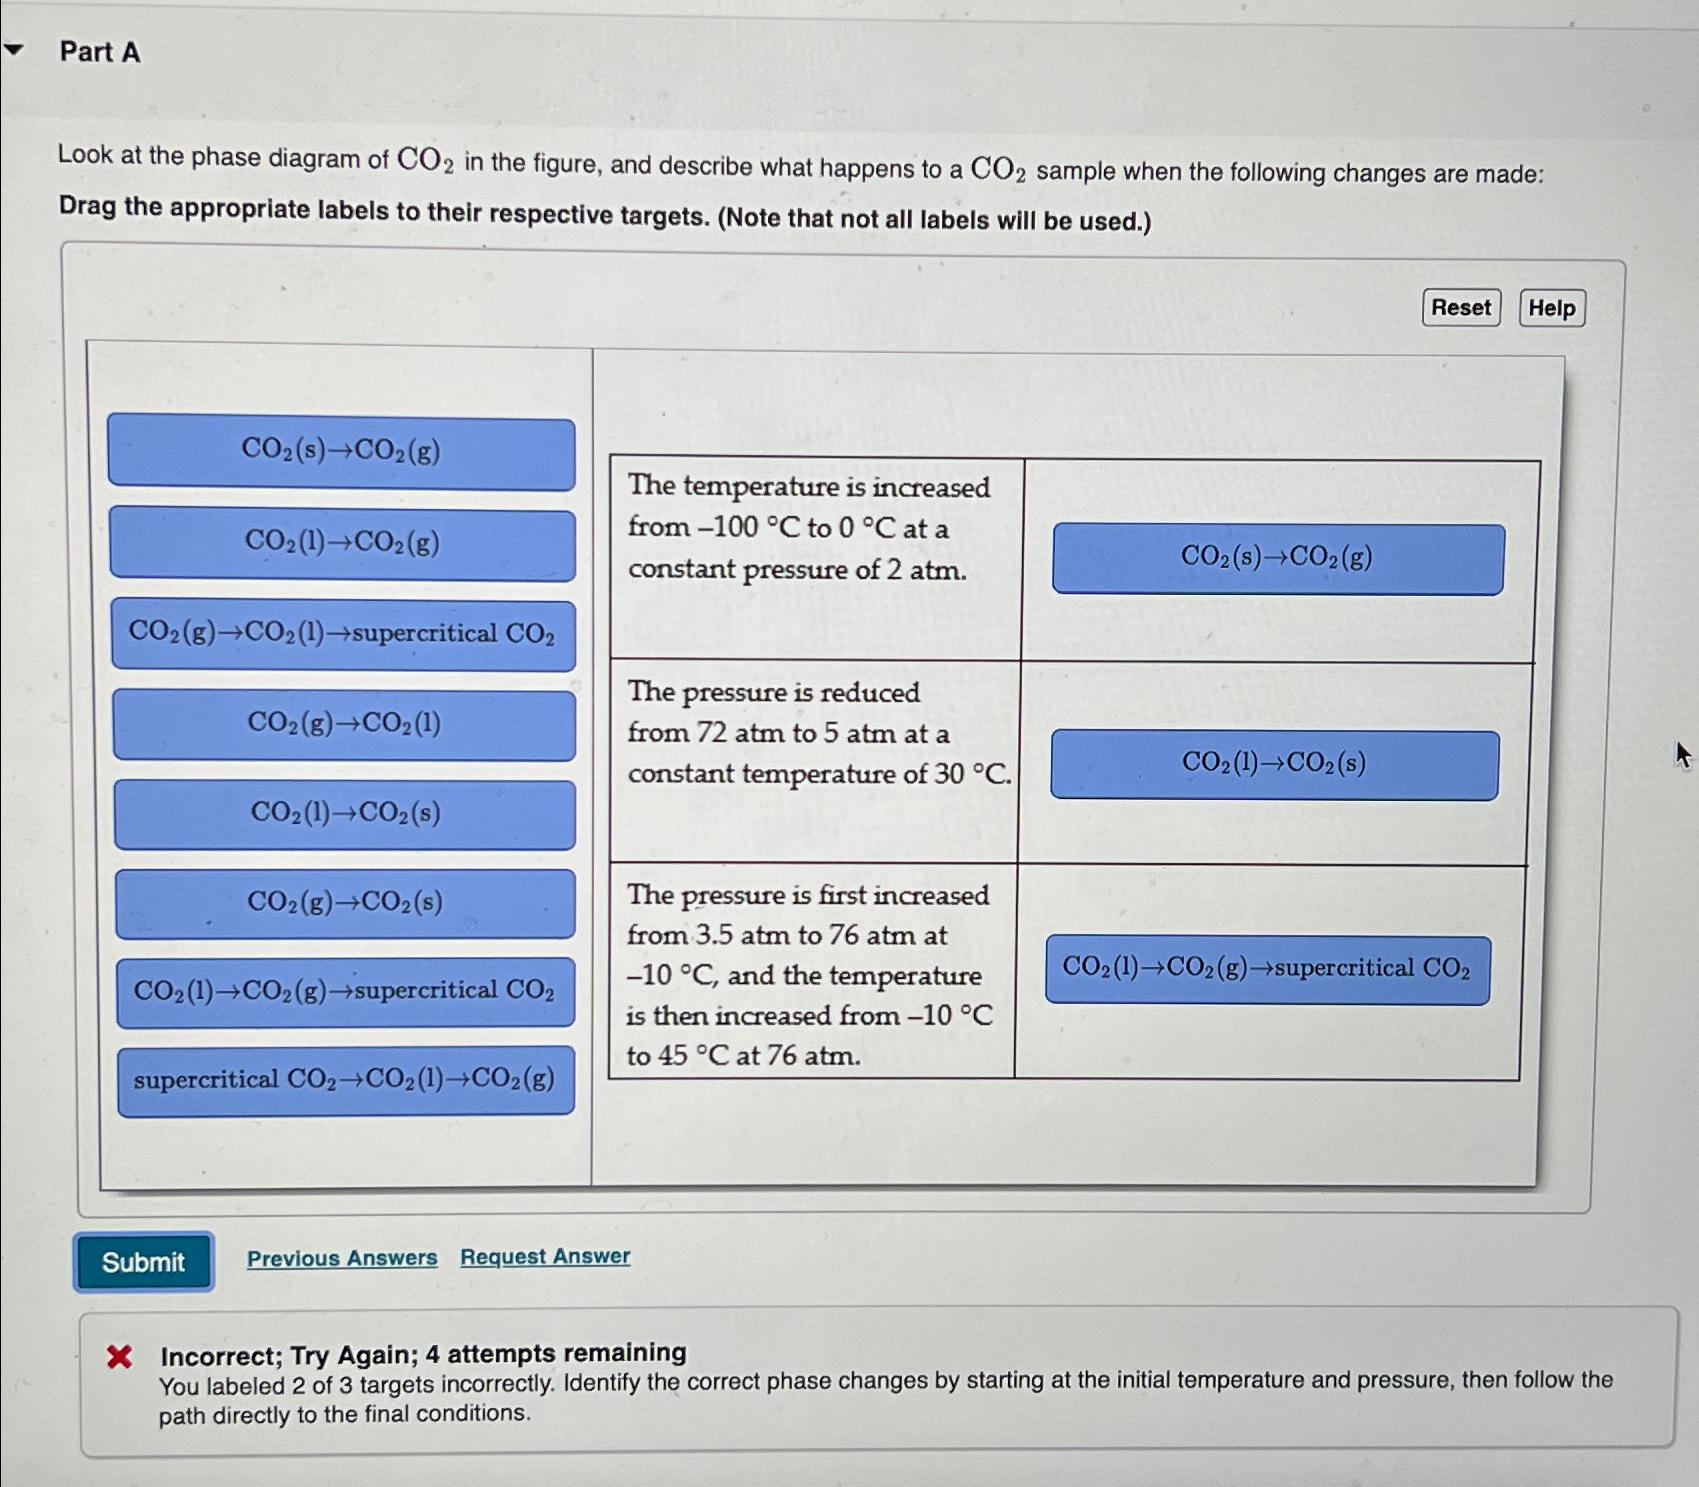
Part A Look at the phase diagram of CO_(2) in the figure, and describe what happens to CO_(2) sample when the following changes are
\ Part A\ Look at the phase diagram of
CO_(2)in the figure, and describe what happens to
CO_(2)sample when the following changes are made: Drag the appropriate labels to their respective targets. (Note that not all labels will be used.)\ \\\\table[[
CO_(2)(s)->CO_(2)(g),\\\\table[[The temperature is increased],[from
-100\\\\deg Cto
0\\\\deg Cat a],[constant pressure of
2atm.]],],[
CO_(2)(l)->CO_(2)(g),
CO_(2)(s)->CO_(2)(g) 
Step by Step Solution
There are 3 Steps involved in it
Step: 1

Get Instant Access to Expert-Tailored Solutions
See step-by-step solutions with expert insights and AI powered tools for academic success
Step: 2

Step: 3

Ace Your Homework with AI
Get the answers you need in no time with our AI-driven, step-by-step assistance
Get Started


