Answered step by step
Verified Expert Solution
Question
1 Approved Answer
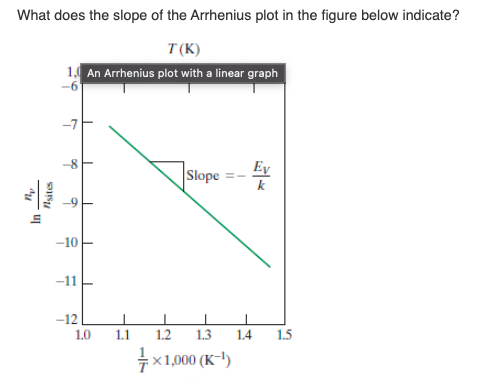
PART A PART B What does the slope of the Arrhenius plot in the figure below indicate? T(K) 1. An Arrhenius plot with a linear
PART A
PART B
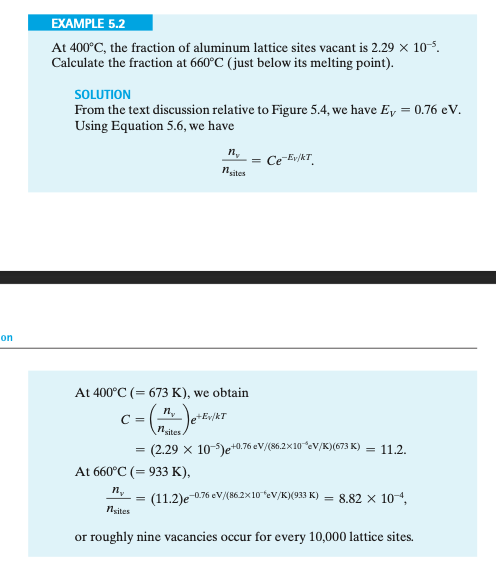
What does the slope of the Arrhenius plot in the figure below indicate? T(K) 1. An Arrhenius plot with a linear graph -1 8 -9 Slope EV k dy Nsites In -10 H -11 -12 1.0 1 1.1 1.2 1.3 1.4 1.5 7X1,000 (K-1) O The energy required to produce one mole of interstitialcies in an aluminum crystal. The energy required to produce one interstitialcy in an aluminum crystal. The energy required to produce one mole of vacancies in an aluminum crystal. The energy required to produce one vacancy in an aluminum crystal. EXAMPLE 5.2 At 400C, the fraction of aluminum lattice sites vacant is 2.29 x 10⁻⁵. Calculate the fraction at 660C (just below its melting point). SOLUTION From the text discussion relative to Figure 5.4, we have Ev = 0.76 eV. Using Equation 5.6, we have n Ce-Ey/T nies on At 400C (=673 K), we obtain ny C= le+Ev/ki c= ( netes = 11.2. (2.29 X 10-)e+0,76 eV/(86.2% 10%V/K)(673 K) At 660C (=933 K), (11.2)e-0.76 eV/(862x10-fev/K)(933 K) = 8.82 x 10⁴, nsites or roughly nine vacancies occur for every 10,000 lattice sites. Review Example Problem 5.2 from the text. If the material has properties of C=12 and Ev=0.8 eV, what is the fraction of vacancies at T= 660 C ? IVO AXO 11 vecStep by Step Solution
There are 3 Steps involved in it
Step: 1
Get Instant Access to Expert-Tailored Solutions
See step-by-step solutions with expert insights and AI powered tools for academic success
Step: 2
Step: 3
Ace Your Homework with AI
Get the answers you need in no time with our AI-driven, step-by-step assistance
Get Started