

Answered step by step
Verified Expert Solution
Question
1 Approved Answer
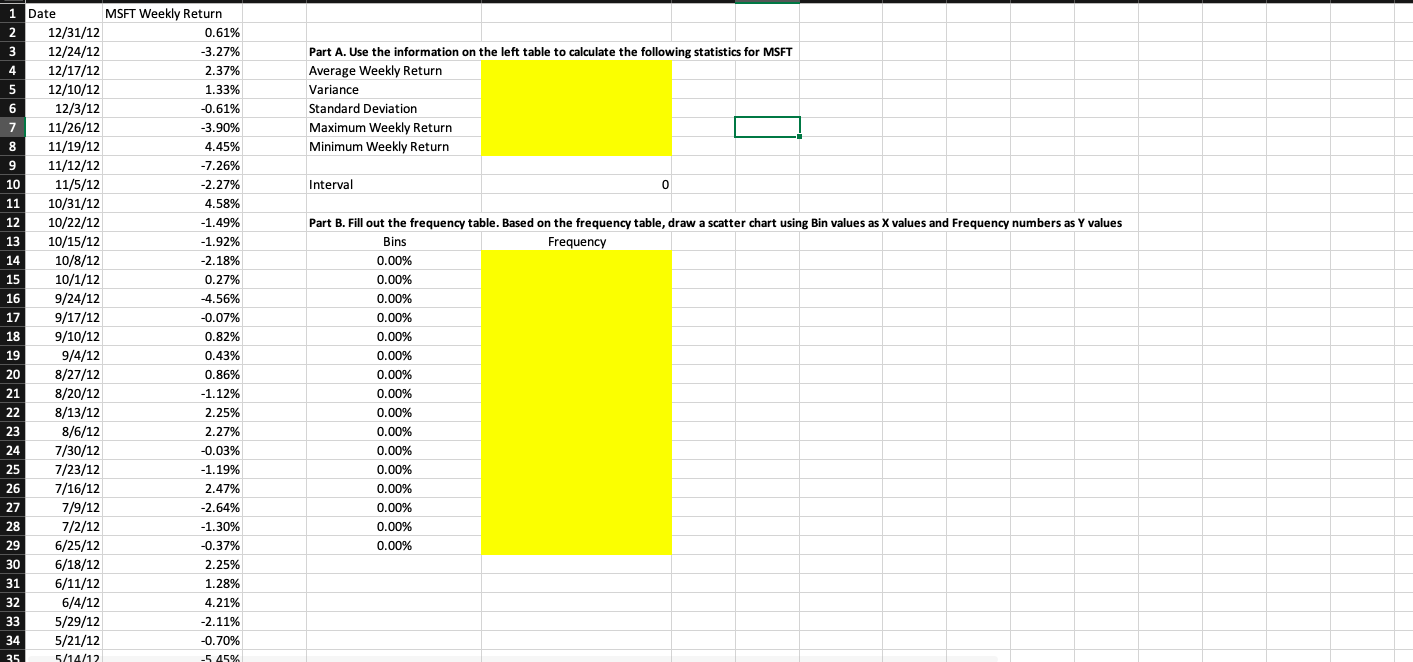
. Part A. Use the information on the left table to calculate the following statistics for MSFT Average Weekly Return Variance Standard Deviation Maximum Weekly
Step by Step Solution
There are 3 Steps involved in it
Step: 1

Get Instant Access to Expert-Tailored Solutions
See step-by-step solutions with expert insights and AI powered tools for academic success
Step: 2

Step: 3
Ace Your Homework with AI
Get the answers you need in no time with our AI-driven, step-by-step assistance
Get Started
Gapenskis Understanding Healthcare Financial Management
Authors: George H. Pink, Paula H. Song
8th Edition
1640551093, 978-1640551091