Part B (18 marks) (Please review pages 346 to 361 of the course textbook)
It is now January 1st, 2021 and your friend has decided to start that new business. They have decided not only to buy equipment but also to sell courses and merchandise.
Part B1: Based on a number of assumptions your friend wants to forecast the first years Income Statement and Balance Sheet. Once again they call upon you to assist them in creating the forecasted statements. In this assignment you are to construct an Income Statement and Balance Sheet based on the assumptions your friend has provided to you. (6 marks)
- First year sales will total $100,000
- Gross margins will be 50%
- Operating margins will be 20%
- Accounts Receivable will be about 15% of sales
- Inventory will be 12% of sales
- Accounts Payable will be 5% of sales
- Accrued expenses payable will be 7% of sales
- The Bank will provide a loan of $50,000. The annual interest will be 4%, compounded annually. Interest-only payments are needed until the loan is due in 5 years, where a balloon payment for the full balance must be paid.
- The combined federal and provincial tax rates will be 30%
- Capital equipment purchases will be made at the start of the year. These will total $70,000. These will depreciate at 10% per year.
- Your friend wants ending cash to be $24,500, to have this amount on hand at year-end.
- Your friend will provide any other capital needed in the form of equity financing.
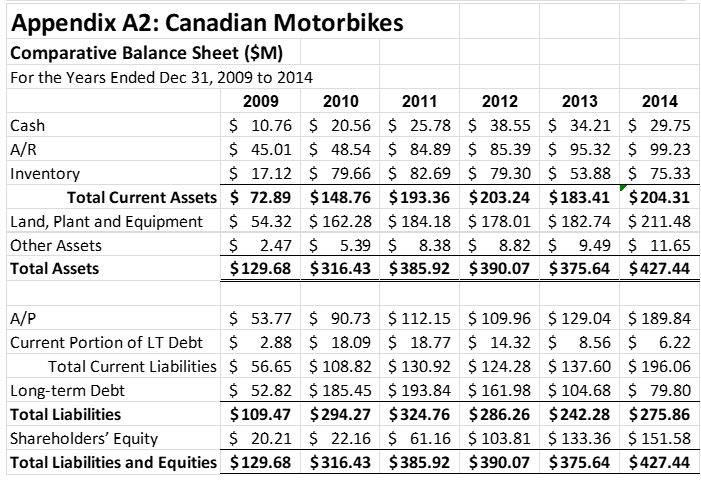
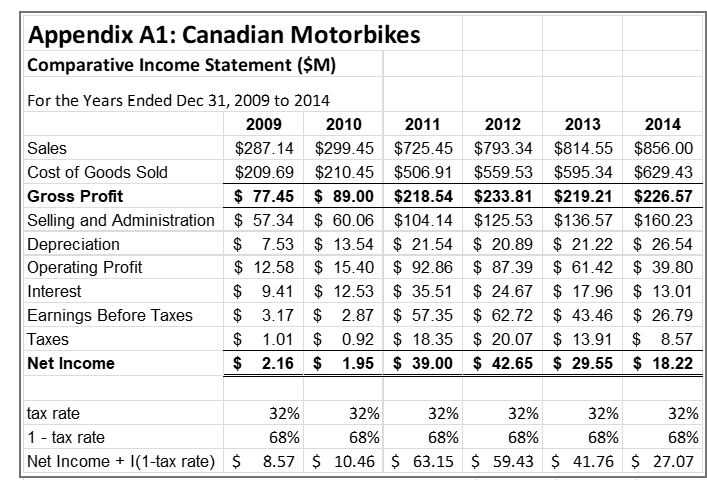
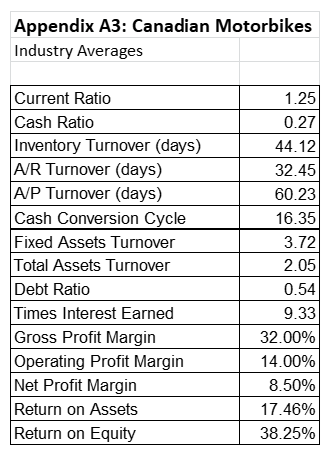
Appendix A2: Canadian Motorbikes Comparative Balance Sheet ($M) For the Years Ended Dec 31, 2009 to 2014 2009 2010 2011 2012 2013 2014 Cash $ 10.76 $ 20.56 $ 25.78 $ 38.55 $ 34.21 $ 29.75 A/R $ 45.01 $ 48.54 $ 84.89 $ 85.39 $ 95.32 $ 99.23 Inventory $ 17.12 $ 79.66 $ 82.69 $ 79.30 $ 53.88 $ 75.33 Total Current Assets $ 72.89 $ 148.76 $ 193.36 $203.24 $183.41 $ 204.31 Land, Plant and Equipment $ 54.32 $ 162.28 $ 184.18 $ 178.01 $ 182.74 $ 211.48 Other Assets $ 2.47 $ 5.39 $ 8.38 $ 8.82 $ 9.49 $ 11.65 Total Assets $129.68 $316.43 $385.92 $390.07 $375.64 $427.44 A/P $ 53.77 $ 90.73 $ 112.15 $ 109.96 $ 129.04 $ 189.84 Current Portion of LT Debt $ 2.88 $ 18.09 $ 18.77 $ 14.32 $ 8.56 $ 6.22 Total Current Liabilities $ 56.65 $ 108.82 $ 130.92 $ 124.28 $ 137.60 $ 196.06 Long-term Debt $ 52.82 $185.45 $ 193.84 $ 161.98 $ 104.68 $ 79.80 Total Liabilities $109.47 $294.27 $324.76 $286.26 $242.28 $275.86 Shareholders' Equity $ 20.21 $ 22.16 $ 61.16 $ 103.81 $ 133.36 $ 151.58 Total Liabilities and Equities $ 129.68 $316.43 $385.92 $390.07 $375.64 $427.44 Appendix A1: Canadian Motorbikes Comparative Income Statement ($M) For the Years Ended Dec 31, 2009 to 2014 2009 2010 2011 2012 2013 2014 Sales $287.14 $299.45 $725.45 $793.34 $814.55 $856.00 Cost of Goods Sold $209.69 $210.45 $506.91 $559.53 $595.34 $629.43 Gross Profit $ 77.45 $ 89.00 $218.54 $233.81 $219.21 $226.57 Selling and Administration $ 57.34 $ 60.06 $104.14 $125.53 $136.57 $160.23 Depreciation $ 7.53 $ 13.54 $ 21.54 $ 20.89 $ 21.22 $ 26.54 Operating Profit $ 12.58 $ 15.40 $ 92.86 $ 87.39 $ 61.42 $ 39.80 Interest $ 9.41 $ 12.53 $ 35.51 $ 24.67 $ 17.96 $ 13.01 Earnings Before Taxes $ 3.17 $ 2.87 $ 57.35 $ 62.72 $ 43.46 $ 26.79 Taxes $ 1.01 $ 0.92 $ 18.35 $ 20.07 $ 13.91 $ 8.57 Net Income $ 2.16 $ 1.95 $39.00 $ 42.65 $29.55 $ 18.22 tax rate 1 - tax rate Net Income + |(1-tax rate) $ 32% 32% 32% 32% 32% 32% 68% 68% 68% 68% 68% 8.57 $ 10.46 $ 63.15 $59.43 $ 41.76 $ 27.07 Appendix A3: Canadian Motorbikes Industry Averages Current Ratio Cash Ratio Inventory Turnover (days) A/R Turnover (days) A/P Turnover (days) Cash Conversion Cycle Fixed Assets Turnover Total Assets Turnover Debt Ratio Times Interest Earned Gross Profit Margin Operating Profit Margin Net Profit Margin Return on Assets Return on Equity 1.25 0.27 44.12 32.45 60.23 16.35 3.72 2.05 0.54 9.33 32.00% 14.00% 8.50% 17.46% 38.25% Appendix A2: Canadian Motorbikes Comparative Balance Sheet ($M) For the Years Ended Dec 31, 2009 to 2014 2009 2010 2011 2012 2013 2014 Cash $ 10.76 $ 20.56 $ 25.78 $ 38.55 $ 34.21 $ 29.75 A/R $ 45.01 $ 48.54 $ 84.89 $ 85.39 $ 95.32 $ 99.23 Inventory $ 17.12 $ 79.66 $ 82.69 $ 79.30 $ 53.88 $ 75.33 Total Current Assets $ 72.89 $ 148.76 $ 193.36 $203.24 $183.41 $ 204.31 Land, Plant and Equipment $ 54.32 $ 162.28 $ 184.18 $ 178.01 $ 182.74 $ 211.48 Other Assets $ 2.47 $ 5.39 $ 8.38 $ 8.82 $ 9.49 $ 11.65 Total Assets $129.68 $316.43 $385.92 $390.07 $375.64 $427.44 A/P $ 53.77 $ 90.73 $ 112.15 $ 109.96 $ 129.04 $ 189.84 Current Portion of LT Debt $ 2.88 $ 18.09 $ 18.77 $ 14.32 $ 8.56 $ 6.22 Total Current Liabilities $ 56.65 $ 108.82 $ 130.92 $ 124.28 $ 137.60 $ 196.06 Long-term Debt $ 52.82 $185.45 $ 193.84 $ 161.98 $ 104.68 $ 79.80 Total Liabilities $109.47 $294.27 $324.76 $286.26 $242.28 $275.86 Shareholders' Equity $ 20.21 $ 22.16 $ 61.16 $ 103.81 $ 133.36 $ 151.58 Total Liabilities and Equities $ 129.68 $316.43 $385.92 $390.07 $375.64 $427.44 Appendix A1: Canadian Motorbikes Comparative Income Statement ($M) For the Years Ended Dec 31, 2009 to 2014 2009 2010 2011 2012 2013 2014 Sales $287.14 $299.45 $725.45 $793.34 $814.55 $856.00 Cost of Goods Sold $209.69 $210.45 $506.91 $559.53 $595.34 $629.43 Gross Profit $ 77.45 $ 89.00 $218.54 $233.81 $219.21 $226.57 Selling and Administration $ 57.34 $ 60.06 $104.14 $125.53 $136.57 $160.23 Depreciation $ 7.53 $ 13.54 $ 21.54 $ 20.89 $ 21.22 $ 26.54 Operating Profit $ 12.58 $ 15.40 $ 92.86 $ 87.39 $ 61.42 $ 39.80 Interest $ 9.41 $ 12.53 $ 35.51 $ 24.67 $ 17.96 $ 13.01 Earnings Before Taxes $ 3.17 $ 2.87 $ 57.35 $ 62.72 $ 43.46 $ 26.79 Taxes $ 1.01 $ 0.92 $ 18.35 $ 20.07 $ 13.91 $ 8.57 Net Income $ 2.16 $ 1.95 $39.00 $ 42.65 $29.55 $ 18.22 tax rate 1 - tax rate Net Income + |(1-tax rate) $ 32% 32% 32% 32% 32% 32% 68% 68% 68% 68% 68% 8.57 $ 10.46 $ 63.15 $59.43 $ 41.76 $ 27.07 Appendix A3: Canadian Motorbikes Industry Averages Current Ratio Cash Ratio Inventory Turnover (days) A/R Turnover (days) A/P Turnover (days) Cash Conversion Cycle Fixed Assets Turnover Total Assets Turnover Debt Ratio Times Interest Earned Gross Profit Margin Operating Profit Margin Net Profit Margin Return on Assets Return on Equity 1.25 0.27 44.12 32.45 60.23 16.35 3.72 2.05 0.54 9.33 32.00% 14.00% 8.50% 17.46% 38.25%