Part B and C, please. 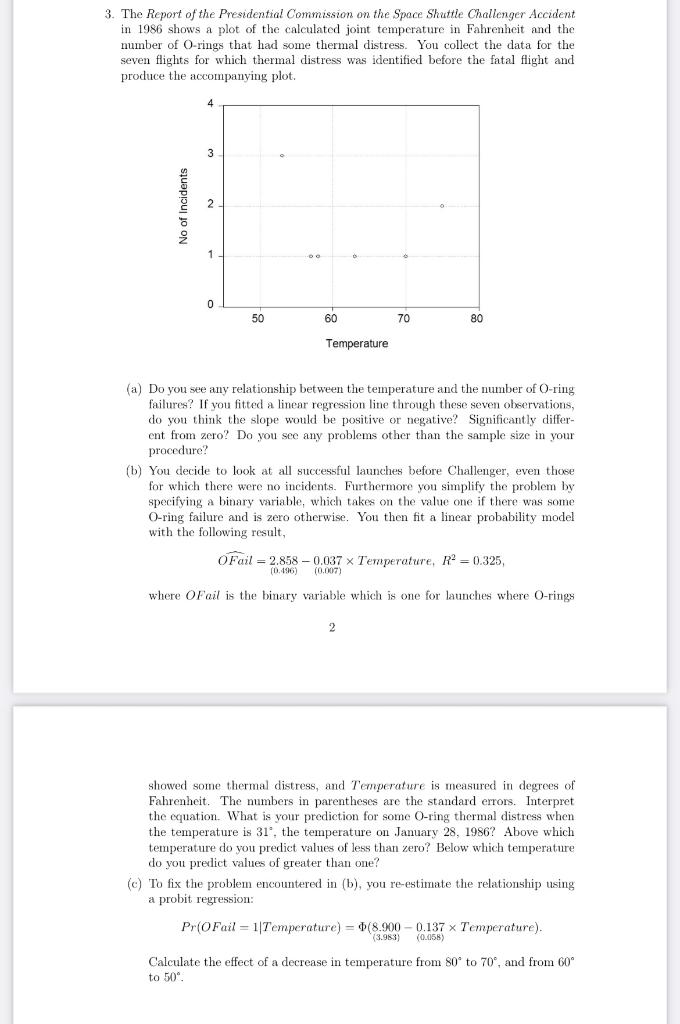
3. The Report of the Presidential Commission on the Space Shuttle Challenger Accident in 1986 shows a plot of the calculated joint temperature in Fahrenheit and the number of O-rings that had some thermal distress. You collect the data for the seven flights for which thermal distress was identified before the fatal flight and produce the accompanying plot. 3 No of Incidents 2 1 0 50 60 70 80 Temperature (a) Do you see any relationship between the temperature and the number of O-ring failures? If you fitted a linear regression line through these seven observations, do you think the slope would be positive or negative? Significantly differ- ent from zero? Do you see any problems other than the sample size in your procedure? (b) You decide to look at all successful launches before Challenger, even those for which there were no incidents. Furthermore you simplify the problem by specifying a binary variable, which takes on the value one if there was some O-ring failure and is zero otherwise. You then fit a linear probability model with the following result, O Fail = 2.858 -0,037 Temperature, R2 = 0.325, (0.196) 10.1007 where OFail is the binary variable which is one for launches where O-rings 2 showed some thermal distress, and Temperature is measured in degrees of Fahrenheit. The numbers in parentheses are the standard errors. Interpret the equation. What is your prediction for some O-ring thermal distress when the temperature is 31', the temperature on January 28, 1986? Above which temperature do you predict values of less than zero? Below which temperature do you predict values of greater than one? (c) To fix the problem encountered in (b), you re-estimate the relationship using a probit regression: Pr(Fail = 1 Temperature) = (8.900 -0.137 x Temperature). ) ) Calculate the effect of a decrease in temperature from 80 to 70, and from 60 to 50 3. The Report of the Presidential Commission on the Space Shuttle Challenger Accident in 1986 shows a plot of the calculated joint temperature in Fahrenheit and the number of O-rings that had some thermal distress. You collect the data for the seven flights for which thermal distress was identified before the fatal flight and produce the accompanying plot. 3 No of Incidents 2 1 0 50 60 70 80 Temperature (a) Do you see any relationship between the temperature and the number of O-ring failures? If you fitted a linear regression line through these seven observations, do you think the slope would be positive or negative? Significantly differ- ent from zero? Do you see any problems other than the sample size in your procedure? (b) You decide to look at all successful launches before Challenger, even those for which there were no incidents. Furthermore you simplify the problem by specifying a binary variable, which takes on the value one if there was some O-ring failure and is zero otherwise. You then fit a linear probability model with the following result, O Fail = 2.858 -0,037 Temperature, R2 = 0.325, (0.196) 10.1007 where OFail is the binary variable which is one for launches where O-rings 2 showed some thermal distress, and Temperature is measured in degrees of Fahrenheit. The numbers in parentheses are the standard errors. Interpret the equation. What is your prediction for some O-ring thermal distress when the temperature is 31', the temperature on January 28, 1986? Above which temperature do you predict values of less than zero? Below which temperature do you predict values of greater than one? (c) To fix the problem encountered in (b), you re-estimate the relationship using a probit regression: Pr(Fail = 1 Temperature) = (8.900 -0.137 x Temperature). ) ) Calculate the effect of a decrease in temperature from 80 to 70, and from 60 to 50