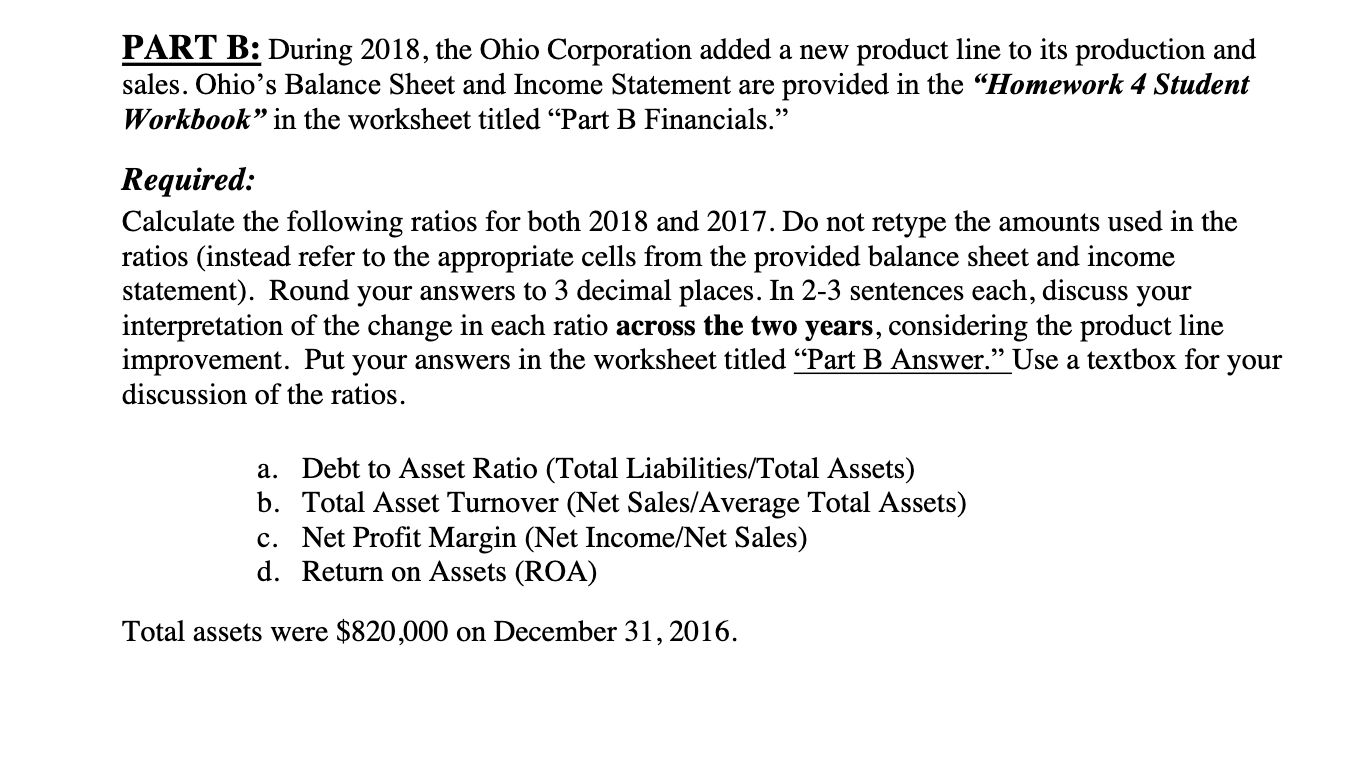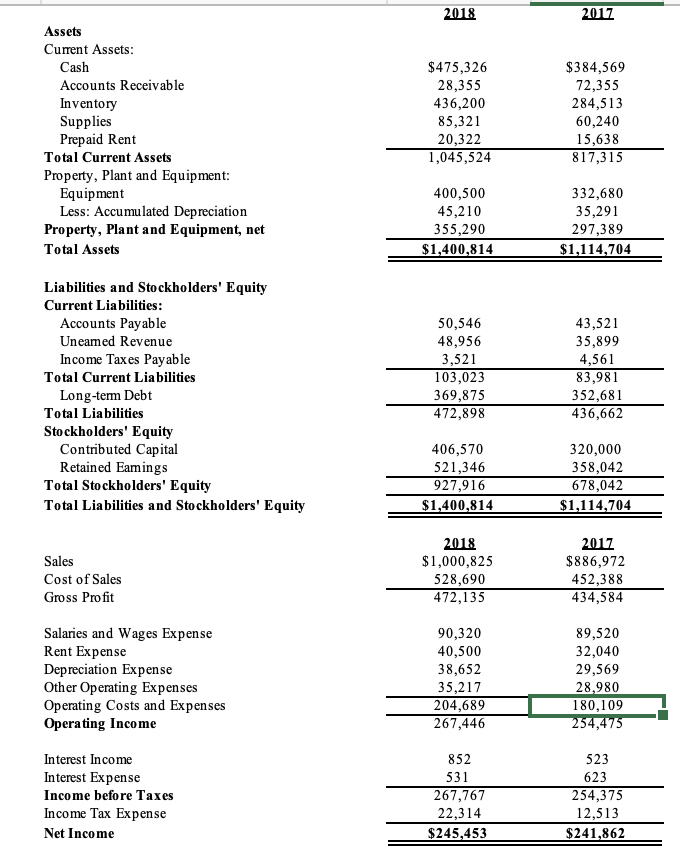

PART B: During 2018, the Ohio Corporation added a new product line to its production and sales. Ohio's Balance Sheet and Income Statement are provided in the Homework 4 Student Workbook" in the worksheet titled Part B Financials. Required: Calculate the following ratios for both 2018 and 2017. Do not retype the amounts used in the ratios (instead refer to the appropriate cells from the provided balance sheet and income statement). Round your answers to 3 decimal places. In 2-3 sentences each, discuss your interpretation of the change in each ratio across the two years, considering the product line improvement. Put your answers in the worksheet titled Part B Answer. Use a textbox for your discussion of the ratios. a. Debt to Asset Ratio (Total Liabilities/Total Assets) b. Total Asset Turnover (Net Sales/Average Total Assets) c. Net Profit Margin (Net Income/Net Sales) d. Return on Assets (ROA) Total assets were $820,000 on December 31, 2016. 2018 2017 Assets Current Assets: Cash Accounts Receivable Inventory Supplies Prepaid Rent Total Current Assets Property, Plant and Equipment: Equipment Less: Accumulated Depreciation Property, Plant and Equipment, net Total Assets $475,326 28,355 436,200 85,321 20,322 1,045,524 $384,569 72,355 284,513 60,240 15,638 817,315 400,500 45,210 355,290 $1,400,814 332,680 35,291 297,389 $1,114,704 Liabilities and Stockholders' Equity Current Liabilities: Accounts Payable Uneamed Revenue Income Taxes Payable Total Current Liabilities Long-term Debt Total Liabilities Stockholders' Equity Contributed Capital Retained Earings Total Stockholders' Equity Total Liabilities and Stockholders' Equity 50,546 48,956 3,521 103,023 369,875 472,898 43,521 35,899 4,561 83,981 352,681 436,662 406,570 521,346 927,916 $1,400,814 320,000 358,042 678,042 $1,114,704 Sales Cost of Sales Gross Profit 2018 $1,000,825 528,690 472,135 2017 $886,972 452,388 434,584 Salaries and Wages Expense Rent Expense Depreciation Expense Other Operating Expenses Operating costs and Expenses Operating Income 90,320 40,500 38,652 35,217 204,689 267,446 89,520 32,040 29,569 28,980 180,109 254,475 Interest Income Interest Expense Income before Taxes Income Tax Expense Net Income 852 531 267,767 22,314 $245,453 523 623 254,375 12,513 $241,862


