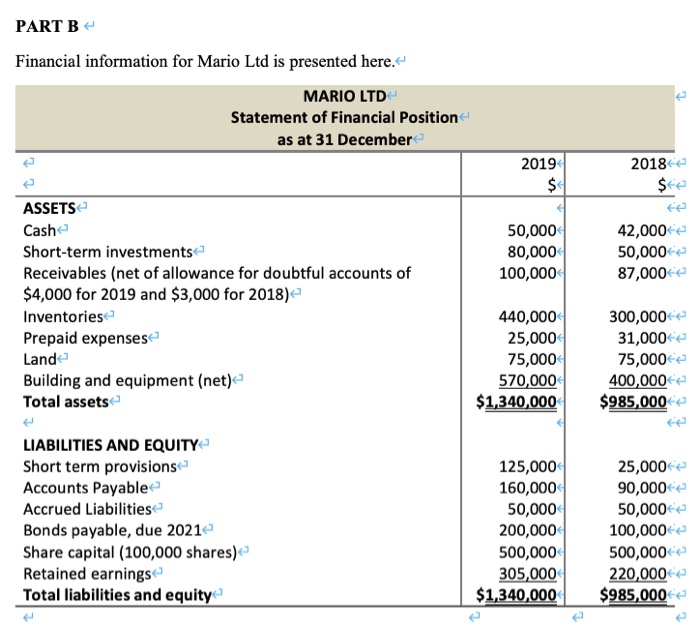
PART B Financial information for Mario Ltd is presented here. MARIO LTD Statement of Financial Position as at 31 December 2019 $ 2018 $te 50,000 80,000 100,000 42,000 50,000 87,000 ASSETS Cash Short-term investments Receivables (net of allowance for doubtful accounts of $4,000 for 2019 and $3,000 for 2018) Inventories Prepaid expenses Lande Building and equipment (net) Total assets 440,000 25,000 75,000 570,000 $1,340,000 300,000 31,000 75,000 400,000 $985,000 LIABILITIES AND EQUITY Short term provisions Accounts Payable Accrued Liabilities Bonds payable, due 2021 Share capital (100,000 shares) Retained earnings Total liabilities and equity 125,000 160,000 50,000 200,000 500,000 305,000 $1,340,000 25,000 90,000 50,000 100,000 500,000 220,000 $985,000 HALIFAX LTD Statement of Profit or Loss for the year ended 30 June Net sales Cost of sales Gross profit Selling and administrative expenses Finance expense Profit before income taxes Income tax expense Profit for the period 2019 $ 780,000 (440,000) 340,000 (143,880) (9.920) 186,200 (29,000) $157,200 2018 $ 856,000 (441,000) 415,000 (149,760) (7.200) 258,040 (24,000) $234,040 THE UNIVERSITY OF QUEENSLAND Liquidity ratios 1. Current ratio Current assets Current liabilities 2. Quick ratio Cash + Marketable securities + Net receivables Current liabilities 3. Current cash debt coverage Net cash provided by operating activities Average current liabilities 4. Receivables turnover Net credit sales Average net trade receivables 5. Average collection period 365 days Receivables turnover 6. Inventory turnover Cost of sales Average inventory 7. Average days in inventory 365 days Mushtaventory turnover CRICOS code 000250 15 THE UNIVERSITY OF QUEENSLAND Profitability ratios 18. Cash return on sales Net cash provided by operating activities Net sales 19. Earnings per share (EPS) Profit Weighted average number of ordinary shares 20. Price/earnings ratio Share price Earnings per share 21. Dividend payout Dividends Profit Hashtag text] CRICOS code 000218 12:48 all Ask for current, quick and earnings per share EP a a