

Question: Part B: for this part, you will use tables from IST302 database as source tables. 1 Create a copy of SALES table from IST302
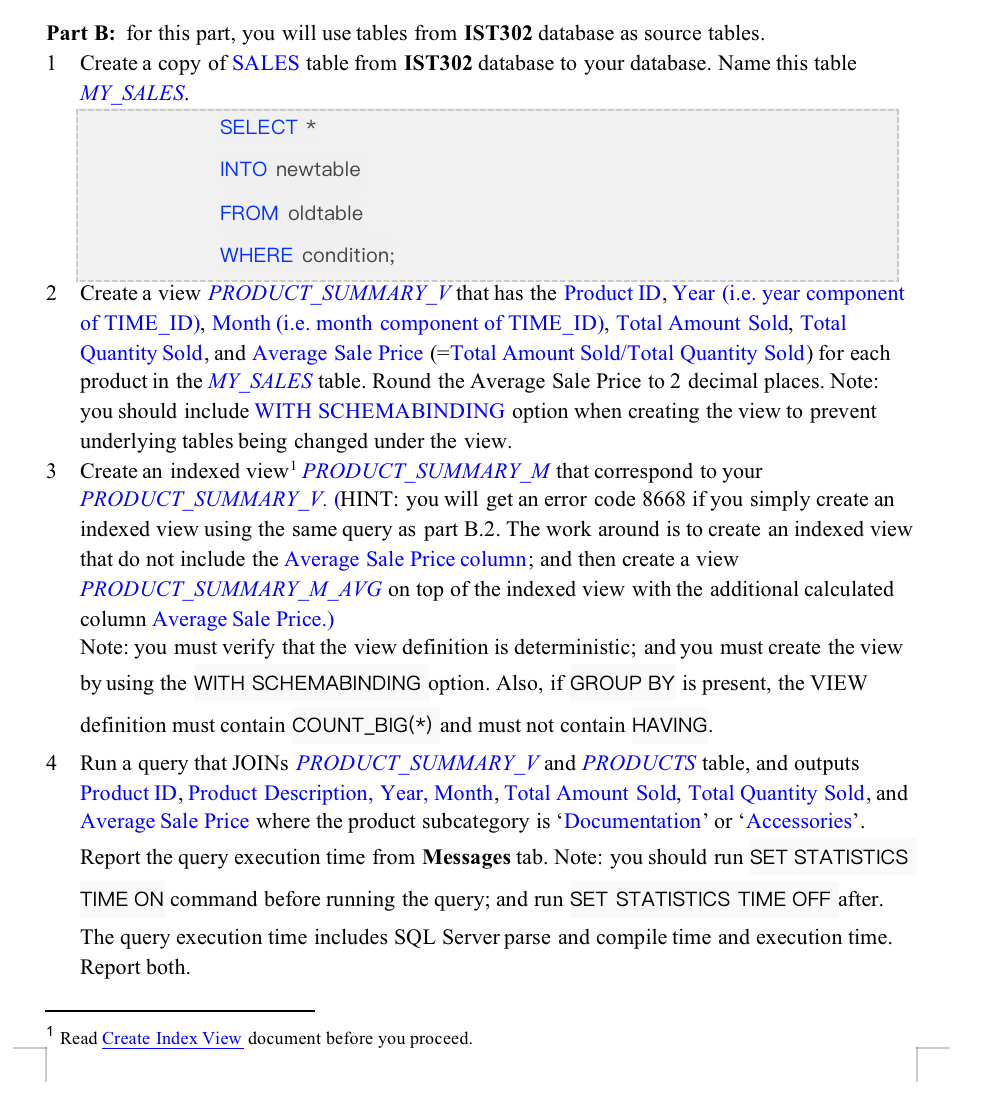
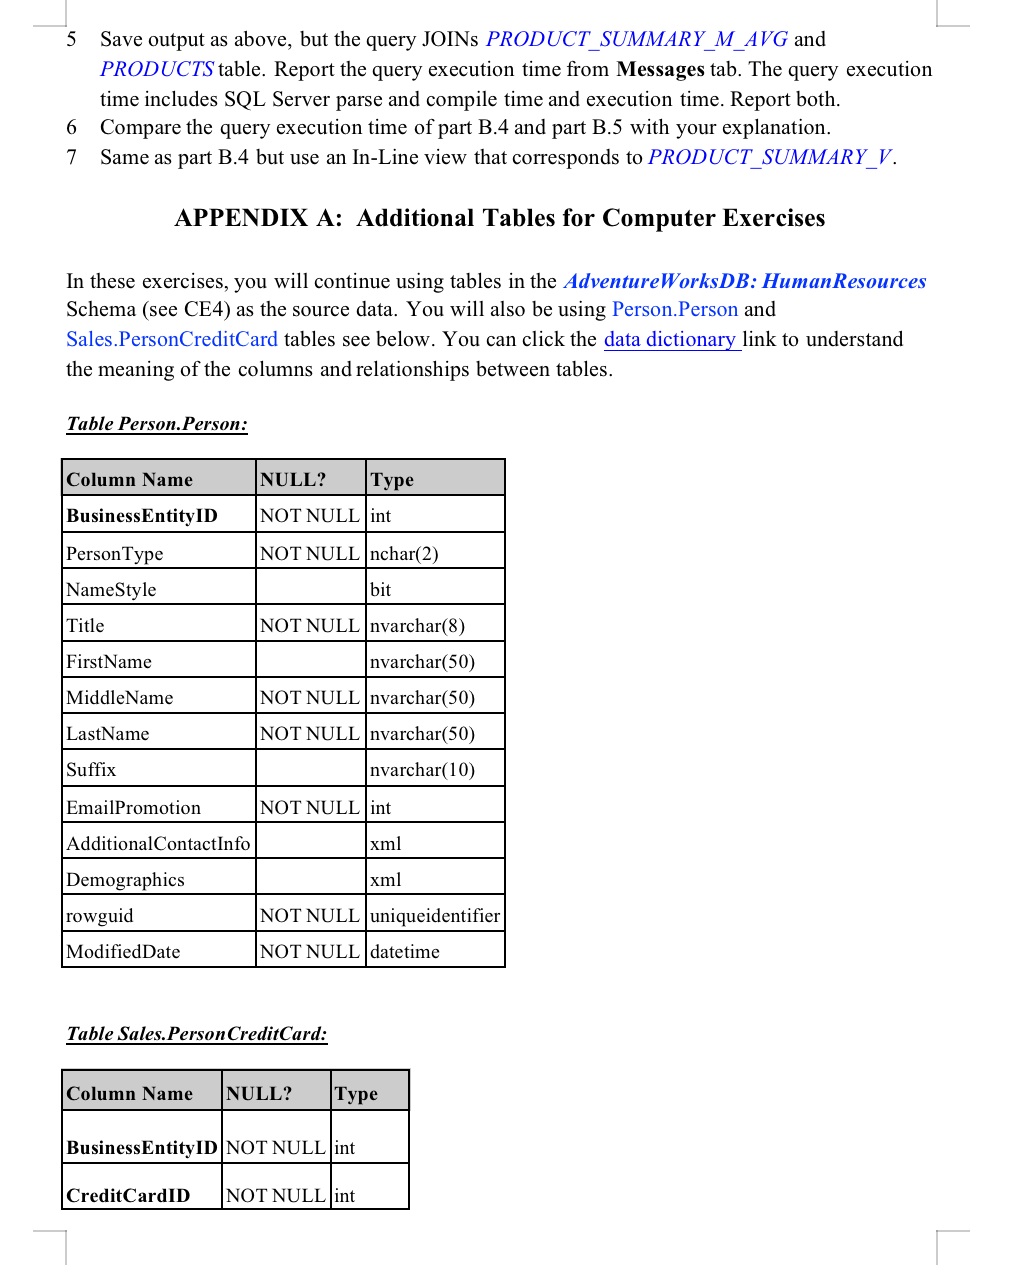
Part B: for this part, you will use tables from IST302 database as source tables. 1 Create a copy of SALES table from IST302 database to your database. Name this table MY SALES. SELECT * INTO newtable FROM oldtable WHERE condition; 2 Create a view PRODUCT SUMMARY_V that has the Product ID, Year (i.e. year component of TIME_ID), Month (i.e. month component of TIME_ID), Total Amount Sold, Total Quantity Sold, and Average Sale Price (=Total Amount Sold/Total Quantity Sold) for each product in the MY_SALES table. Round the Average Sale Price to 2 decimal places. Note: you should include WITH SCHEMABINDING option when creating the view to prevent underlying tables being changed under the view. Create an indexed view PRODUCT_SUMMARY_M that correspond to your PRODUCT_SUMMARY_V. (HINT: you will get an error code 8668 if you simply create an indexed view using the same query as part B.2. The work around is to create an indexed view that do not include the Average Sale Price column; and then create a view PRODUCT_SUMMARY_M_AVG on top of the indexed view with the additional calculated column Average Sale Price.) Note: you must verify that the view definition is deterministic; and you must create the view by using the WITH SCHEMABINDING option. Also, if GROUP BY is present, the VIEW definition must contain COUNT_BIG(*) and must not contain HAVING. 3 4 Run a query that JOINS PRODUCT_SUMMARY_V and PRODUCTS table, and outputs Product ID, Product Description, Year, Month, Total Amount Sold, Total Quantity Sold, and Average Sale Price where the product subcategory is 'Documentation' or 'Accessories'. Report the query execution time from Messages tab. Note: you should run SET STATISTICS TIME ON command before running the query; and run SET STATISTICS TIME OFF after. The query execution time includes SQL Server parse and compile time and execution time. Report both. 1 Read Create Index View document before you proceed. 5 Save output as above, but the query JOINS PRODUCT_SUMMARY_M_AVG and PRODUCTS table. Report the query execution time from Messages tab. The query execution time includes SQL Server parse and compile time and execution time. Report both. Compare the query execution time of part B.4 and part B.5 with your explanation. 6 7 Same as part B.4 but use an In-Line view that corresponds to PRODUCT_SUMMARY_V. APPENDIX A: Additional Tables for Computer Exercises In these exercises, you will continue using tables in the AdventureWorksDB: Human Resources Schema (see CE4) as the source data. You will also be using Person.Person and Sales. PersonCreditCard tables see below. You can click the data dictionary link to understand the meaning of the columns and relationships between tables. Table Person. Person: Column Name Business EntityID PersonType NameStyle Title FirstName MiddleName LastName Suffix EmailPromotion Additional Contact Info Demographics rowguid ModifiedDate NULL? NOT NULL int NOT NULL nchar(2) bit Credit CardID NOT NULL |nvarchar(8) nvarchar (50) NOT NULL |nvarchar (50) NOT NULL |nvarchar(50) Invarchar(10) NOT NULL |int xml xml Table Sales. Person Credit Card: NOT NULL uniqueidentifier | NOT NULL datetime Column Name NULL? Type Business EntityID NOT NULL int NOT NULL int L
Step by Step Solution
There are 3 Steps involved in it
Answer Create an indexed view without Average Sale Price ... View full answer

Get step-by-step solutions from verified subject matter experts