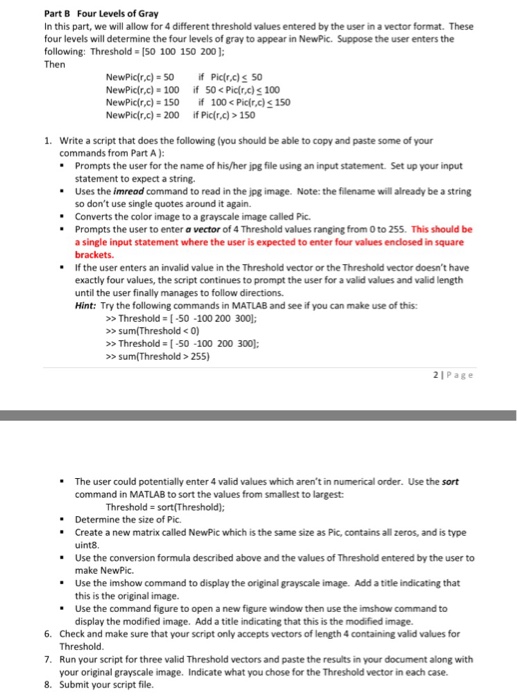
Part B Four Levels of Gray In this part, we will allow for 4 different threshold values entered by the user in a vector format. These four levels will determine the four levels of gray to appear in NewPic. Suppose the user enters the following: Threshold- [50 100 150 200 Then NewPic(r,c)-100 if 50150 1. Write a script that does the following (you should be able to copy and paste some of your commands from Part A ) Prompts the user for the name of his/her jpg file using an input statement. Set up your input statement to expect a string - Uses the imread command to read in the jpg image. Note: the fillename will already be a string so don't use single quotes around it again. Converts the color image to a grayscale image called Pic. Prompts the user to enter a vector of 4 Threshold values ranging from 0 to 255. This should be a single input statement where the user is expected to enter four values enclosed in square brackets If the user enters an invalid value in the Threshold vector or the Threshold vector doesn't have exactly four values, the script continues to prompt the user for a valid values and valid length until the user finally manages to follow directions. Hint: Try the following commands in MATLAB and see if you can make use of this: - >> Threshold=[-50-100 200 3001; >sum(Threshold Threshold-[-50 -100 200 300] > sum(Threshold > 255) 21Page The user could potentially enter 4 valid values which aren't in numerical order. Use the sort command in MATLAB to sort the values from smallest to largest: Threshold-sort(Threshold); Determine the size of Pic. Create a new matrix called NewPic which is the same size as Pic, contains all zeros, and is type uint8. Use the conversion formula described above and the values of Threshold entered by the user to make NewPic. Use the imshow command to display the original grayscale image. Add a title indicating that this is the original image. Use the command figure to open a new figure window then use the imshow command to display the modified image. Add a title indicating that this is the modified image. - - - - - 6. 7. 8. Check and make sure that your script only accepts vectors of length 4 containing valid values for Threshold Run your script for three valid Threshold vectors and paste the results in your document along with your original grayscale image. Indicate what you chose for the Threshold vector in each case. Submit your script file


