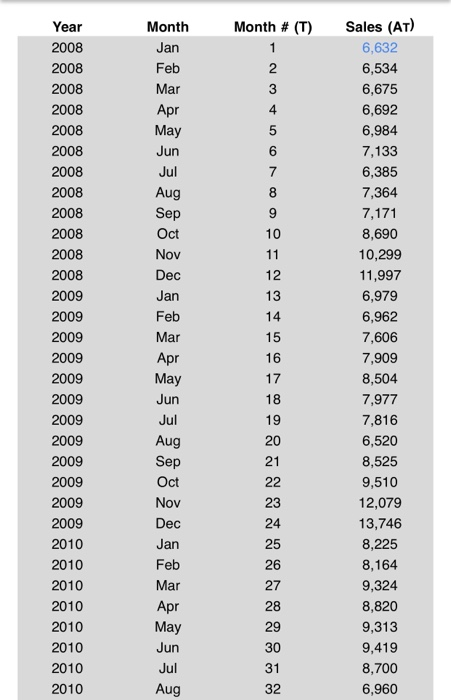
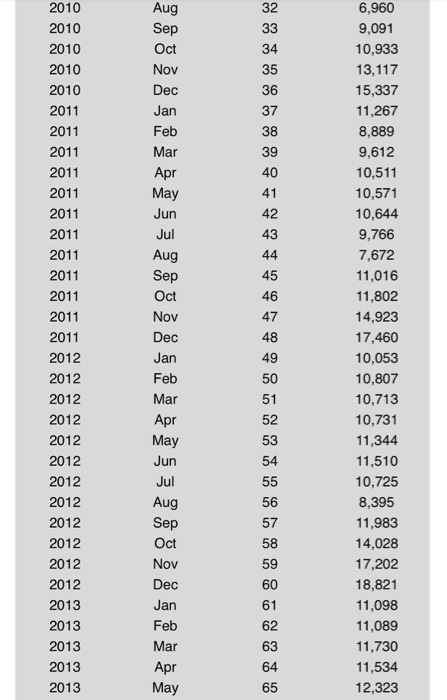
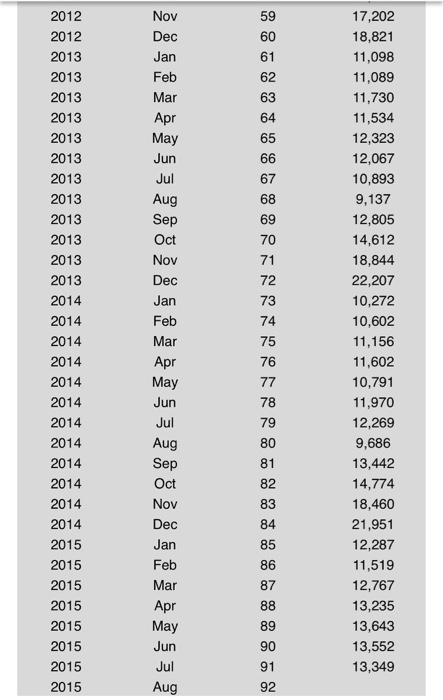
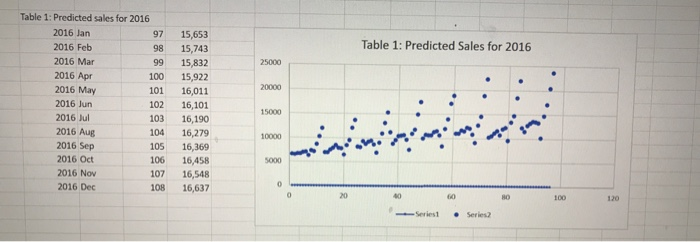
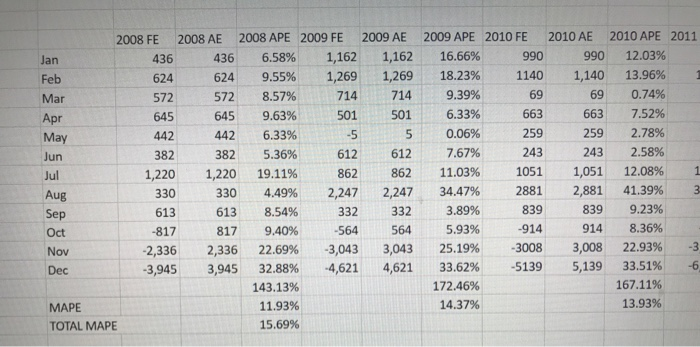
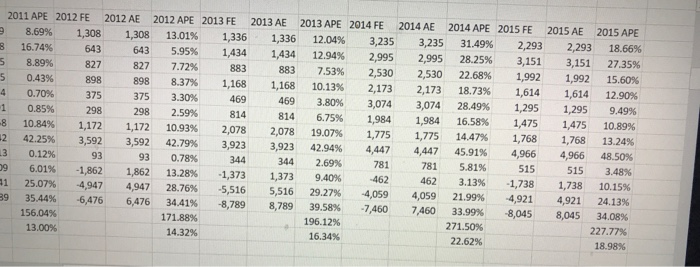
. Part (B): Second, use your suggested improvement to obtain a monthly sales forecast for each month in 2016 (ie. Jan 2016 through Dec 2016). Please organize the predicted sales for 2016 in a table accordingly. Label this table as "Table 2: Improved Predicted Sales for 2016". Part (C): Third, re-calculate the MAPE using the improvement you suggested for the historical data set 2008- 2015. For full credit, your suggestion must reduce the MAPE by at least 5% relative to the original regression approach as discussed in Item 1. Please highlight the overall reduction in MAPE achieved by your suggested improvement Month # (T) 1 2 3 4 5 6 7 8 9 Year 2008 2008 2008 2008 2008 2008 2008 2008 2008 2008 2008 2008 2009 2009 2009 2009 2009 2009 2009 2009 2009 2009 2009 2009 2010 2010 2010 2010 2010 2010 2010 2010 Month Jan Feb Mar Apr May Jun Jul Aug Sep Oct Nov Dec Jan Feb Mar Apr May Jun Jul Aug Sep Oct Nov Dec Jan Feb Mar Apr May Jun Jul Aug 10 11 12 13 14 15 16 17 18 19 20 21 22 23 24 25 26 27 28 29 30 31 32 Sales (AT) 6,632 6,534 6,675 6,692 6,984 7,133 6,385 7,364 7,171 8,690 10,299 11,997 6,979 6,962 7,606 7,909 8,504 7,977 7,816 6,520 8,525 9,510 12,079 13,746 8,225 8,164 9,324 8,820 9,313 9,419 8,700 6,960 Aug Sep Oct Nov Dec Jan Feb Mar Apr May 2010 2010 2010 2010 2010 2011 2011 2011 2011 2011 2011 2011 2011 2011 2011 2011 2011 2012 2012 2012 2012 2012 2012 2012 2012 2012 2012 2012 2012 2013 2013 2013 2013 2013 Jun Jul Aug Sep Oct Nov Dec Jan Feb Mar Apr May Jun Jul 32 33 34 35 36 37 38 39 40 41 42 43 44 45 46 47 48 49 50 51 52 53 54 55 56 57 58 59 60 61 62 63 64 65 6,960 9,091 10,933 13,117 15,337 11,267 8,889 9,612 10,511 10,571 10,644 9,766 7,672 11,016 11,802 14,923 17,460 10,053 10,807 10,713 10,731 11,344 11,510 10,725 8,395 11,983 14,028 17,202 18,821 11,098 11,089 11,730 11,534 12,323 Aug Sep Oct Nov Dec Jan Feb Mar Apr May Nov Dec Jan Feb Mar Apr May Jun Jul Aug Sep Oct Nov Dec Jan Feb Mar 2012 2012 2013 2013 2013 2013 2013 2013 2013 2013 2013 2013 2013 2013 2014 2014 2014 2014 2014 2014 2014 2014 2014 2014 2014 2014 2015 2015 2015 2015 2015 2015 2015 2015 59 60 61 62 63 64 65 66 67 68 69 70 71 72 73 74 75 76 77 78 79 80 81 82 17,202 18,821 11,098 11,089 11,730 11,534 12,323 12,067 10,893 9,137 12,805 14,612 18,844 22,207 10,272 10,602 11,156 11,602 10,791 11,970 12,269 9,686 13,442 14,774 18,460 21,951 12,287 11,519 12,767 13,235 13,643 13,552 13,349 Apr May Jun Jul 83 Aug Sep Oct Nov Dec Jan Feb Mar Apr May Jun Jul Aug 84 85 86 87 88 89 90 91 92 93 94 2015 2015 2015 2015 Sep Oct Nov Dec 14,781 17,123 20,396 23,609 95 96 Table 1: Predicted Sales for 2016 25000 20000 . Table 1: Predicted sales for 2016 2016 Jan 97 2016 Feb 98 2016 Mar 99 2016 Apr 100 2016 May 101 2016 Jun 102 2016 Jul 103 2016 Aug 2016 Sep 105 2016 Oct 106 2016 Nov 107 2016 Dec 108 15,653 15,743 15,832 15,922 16,011 16,101 16,190 16,279 16,369 16,458 16,548 16,637 El lindi 15000 104 10000 5000 0 20 60 HO 100 120 Series1 Series2 Jan 2008 FE 2008 AE 2008 APE 2009 FE 2009 AE 436 436 6.58% 1,162 1,162 Feb 624 624 9.55% 1,269 1,269 Mar 572 572 8.57% 714 714 Apr 645 645 9.63% 501 501 May 442 442 6.33% -5 5 Jun 382 382 5.36% 612 612 Jul 1,220 1,220 19.11% 862 862 Aug 330 330 4.49% 2,247 2,247 Sep 613 613 8.54% 332 332 Oct -8 817 9.40% -564 564 Nov -2,336 2,336 22.69% -3,043 3,043 Dec -3,945 3,945 32.88% -4,621 4,621 143.13% MAPE 11.93% TOTAL MAPE 15.69% 2009 APE 2010 FE 2010 AE 2010 APE 2011 16.66% 990 990 12.03% 18.23% 1140 1,140 13.96% 9.39% 69 69 0.74% 6.33% 663 663 7.52% 0.06% 259 259 2.78% 7.67% 243 243 2.58% 11.03% 1051 1,051 12.08% 1 34.47% 2881 2,881 41.39% 3 3.89% 839 839 9.23% 5.93% -914 914 8.36% 25.19% -3008 3,008 22.93% -3 33.62% -5139 5,139 33.51% -6 172.46% 167.11% 14.37% 13.93% 2011 APE 2012 FE 2012 AE 2012 APE 2013 FE 2013 AE 2013 APE 2014 FE 2014 AE 2014 APE 2015 FE 8.69% 1,308 1,308 13.01% 1,336 1,336 12.04% 3,235 3,235 31.49% 2,293 8 16.74% 643 643 5.95% 1,434 1,434 12.94% 2,995 2,995 28.25% 3,151 5 8.89% 827 827 7.72% 883 883 7.53% 2,530 2,530 22.68% 1,992 5 0.43% 898 898 8.37% 1,168 1,168 10.13% 2,173 2,173 18.73% 1,614 4 0.70% 375 375 3.30% 469 469 3.80% 3,074 3,074 28.49% 1,295 1 0.85% 298 298 2.59% 814 814 6.75% 1,984 1,984 16.58% 1,475 -8 10.84% 1,172 1,172 10.93% 2,078 2,078 19.07% 1,775 1,775 14.47% 1,768 -2 42.25% 3,592 3,592 42.79% 3,923 3,923 42.94% 4,447 4,447 45.91% 4,966 3 0.12% 93 93 0.78% 344 344 2.69% 781 781 5.81% 515 19 6.01% -1,862 1,862 13.28% -1,373 1,373 9.40% -462 462 3.13% -1,738 1 25.07% -4,947 4,947 28.76% -5,516 5,516 29.27% -4,059 4,059 21.99% -4,921 89 35.44% -6,476 6,476 34.41% -8,789 8,789 39.58% -7,460 7,460 33.99% -8,045 156.04% 171.88% 196.12% 271.50% 13.00% 14.32% 16.34% 22.62% 2015 AE 2015 APE 2,293 18.66% 3,151 27.35% 1,992 15.60% 1,614 12.90% 1,295 9.49% 1,475 10.89% 1,768 13.24% 4,966 48.50% 515 3.48% 1,738 10.15% 4,921 24.13% 8,045 34.08% 227.77% 18.98% . Part (B): Second, use your suggested improvement to obtain a monthly sales forecast for each month in 2016 (ie. Jan 2016 through Dec 2016). Please organize the predicted sales for 2016 in a table accordingly. Label this table as "Table 2: Improved Predicted Sales for 2016". Part (C): Third, re-calculate the MAPE using the improvement you suggested for the historical data set 2008- 2015. For full credit, your suggestion must reduce the MAPE by at least 5% relative to the original regression approach as discussed in Item 1. Please highlight the overall reduction in MAPE achieved by your suggested improvement Month # (T) 1 2 3 4 5 6 7 8 9 Year 2008 2008 2008 2008 2008 2008 2008 2008 2008 2008 2008 2008 2009 2009 2009 2009 2009 2009 2009 2009 2009 2009 2009 2009 2010 2010 2010 2010 2010 2010 2010 2010 Month Jan Feb Mar Apr May Jun Jul Aug Sep Oct Nov Dec Jan Feb Mar Apr May Jun Jul Aug Sep Oct Nov Dec Jan Feb Mar Apr May Jun Jul Aug 10 11 12 13 14 15 16 17 18 19 20 21 22 23 24 25 26 27 28 29 30 31 32 Sales (AT) 6,632 6,534 6,675 6,692 6,984 7,133 6,385 7,364 7,171 8,690 10,299 11,997 6,979 6,962 7,606 7,909 8,504 7,977 7,816 6,520 8,525 9,510 12,079 13,746 8,225 8,164 9,324 8,820 9,313 9,419 8,700 6,960 Aug Sep Oct Nov Dec Jan Feb Mar Apr May 2010 2010 2010 2010 2010 2011 2011 2011 2011 2011 2011 2011 2011 2011 2011 2011 2011 2012 2012 2012 2012 2012 2012 2012 2012 2012 2012 2012 2012 2013 2013 2013 2013 2013 Jun Jul Aug Sep Oct Nov Dec Jan Feb Mar Apr May Jun Jul 32 33 34 35 36 37 38 39 40 41 42 43 44 45 46 47 48 49 50 51 52 53 54 55 56 57 58 59 60 61 62 63 64 65 6,960 9,091 10,933 13,117 15,337 11,267 8,889 9,612 10,511 10,571 10,644 9,766 7,672 11,016 11,802 14,923 17,460 10,053 10,807 10,713 10,731 11,344 11,510 10,725 8,395 11,983 14,028 17,202 18,821 11,098 11,089 11,730 11,534 12,323 Aug Sep Oct Nov Dec Jan Feb Mar Apr May Nov Dec Jan Feb Mar Apr May Jun Jul Aug Sep Oct Nov Dec Jan Feb Mar 2012 2012 2013 2013 2013 2013 2013 2013 2013 2013 2013 2013 2013 2013 2014 2014 2014 2014 2014 2014 2014 2014 2014 2014 2014 2014 2015 2015 2015 2015 2015 2015 2015 2015 59 60 61 62 63 64 65 66 67 68 69 70 71 72 73 74 75 76 77 78 79 80 81 82 17,202 18,821 11,098 11,089 11,730 11,534 12,323 12,067 10,893 9,137 12,805 14,612 18,844 22,207 10,272 10,602 11,156 11,602 10,791 11,970 12,269 9,686 13,442 14,774 18,460 21,951 12,287 11,519 12,767 13,235 13,643 13,552 13,349 Apr May Jun Jul 83 Aug Sep Oct Nov Dec Jan Feb Mar Apr May Jun Jul Aug 84 85 86 87 88 89 90 91 92 93 94 2015 2015 2015 2015 Sep Oct Nov Dec 14,781 17,123 20,396 23,609 95 96 Table 1: Predicted Sales for 2016 25000 20000 . Table 1: Predicted sales for 2016 2016 Jan 97 2016 Feb 98 2016 Mar 99 2016 Apr 100 2016 May 101 2016 Jun 102 2016 Jul 103 2016 Aug 2016 Sep 105 2016 Oct 106 2016 Nov 107 2016 Dec 108 15,653 15,743 15,832 15,922 16,011 16,101 16,190 16,279 16,369 16,458 16,548 16,637 El lindi 15000 104 10000 5000 0 20 60 HO 100 120 Series1 Series2 Jan 2008 FE 2008 AE 2008 APE 2009 FE 2009 AE 436 436 6.58% 1,162 1,162 Feb 624 624 9.55% 1,269 1,269 Mar 572 572 8.57% 714 714 Apr 645 645 9.63% 501 501 May 442 442 6.33% -5 5 Jun 382 382 5.36% 612 612 Jul 1,220 1,220 19.11% 862 862 Aug 330 330 4.49% 2,247 2,247 Sep 613 613 8.54% 332 332 Oct -8 817 9.40% -564 564 Nov -2,336 2,336 22.69% -3,043 3,043 Dec -3,945 3,945 32.88% -4,621 4,621 143.13% MAPE 11.93% TOTAL MAPE 15.69% 2009 APE 2010 FE 2010 AE 2010 APE 2011 16.66% 990 990 12.03% 18.23% 1140 1,140 13.96% 9.39% 69 69 0.74% 6.33% 663 663 7.52% 0.06% 259 259 2.78% 7.67% 243 243 2.58% 11.03% 1051 1,051 12.08% 1 34.47% 2881 2,881 41.39% 3 3.89% 839 839 9.23% 5.93% -914 914 8.36% 25.19% -3008 3,008 22.93% -3 33.62% -5139 5,139 33.51% -6 172.46% 167.11% 14.37% 13.93% 2011 APE 2012 FE 2012 AE 2012 APE 2013 FE 2013 AE 2013 APE 2014 FE 2014 AE 2014 APE 2015 FE 8.69% 1,308 1,308 13.01% 1,336 1,336 12.04% 3,235 3,235 31.49% 2,293 8 16.74% 643 643 5.95% 1,434 1,434 12.94% 2,995 2,995 28.25% 3,151 5 8.89% 827 827 7.72% 883 883 7.53% 2,530 2,530 22.68% 1,992 5 0.43% 898 898 8.37% 1,168 1,168 10.13% 2,173 2,173 18.73% 1,614 4 0.70% 375 375 3.30% 469 469 3.80% 3,074 3,074 28.49% 1,295 1 0.85% 298 298 2.59% 814 814 6.75% 1,984 1,984 16.58% 1,475 -8 10.84% 1,172 1,172 10.93% 2,078 2,078 19.07% 1,775 1,775 14.47% 1,768 -2 42.25% 3,592 3,592 42.79% 3,923 3,923 42.94% 4,447 4,447 45.91% 4,966 3 0.12% 93 93 0.78% 344 344 2.69% 781 781 5.81% 515 19 6.01% -1,862 1,862 13.28% -1,373 1,373 9.40% -462 462 3.13% -1,738 1 25.07% -4,947 4,947 28.76% -5,516 5,516 29.27% -4,059 4,059 21.99% -4,921 89 35.44% -6,476 6,476 34.41% -8,789 8,789 39.58% -7,460 7,460 33.99% -8,045 156.04% 171.88% 196.12% 271.50% 13.00% 14.32% 16.34% 22.62% 2015 AE 2015 APE 2,293 18.66% 3,151 27.35% 1,992 15.60% 1,614 12.90% 1,295 9.49% 1,475 10.89% 1,768 13.24% 4,966 48.50% 515 3.48% 1,738 10.15% 4,921 24.13% 8,045 34.08% 227.77% 18.98%

