

Answered step by step
Verified Expert Solution
Question
1 Approved Answer
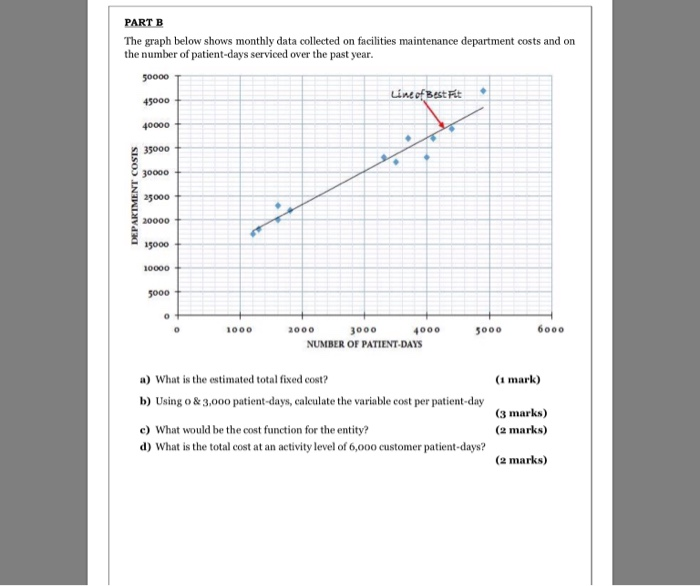
PART B The graph below shows monthly data collected on facilities maintenance department costs and on the number of patient-days serviced over the past year.
Step by Step Solution
There are 3 Steps involved in it
Step: 1

Get Instant Access to Expert-Tailored Solutions
See step-by-step solutions with expert insights and AI powered tools for academic success
Step: 2

Step: 3
Ace Your Homework with AI
Get the answers you need in no time with our AI-driven, step-by-step assistance
Get Started
Managerial Accounting
Authors: Ray Garrison, Eric Noreen and Peter Brewer
14th edition
978-007811100, 78111005, 978-0078111006