

Question
Part B. Using the figures provided you will calculate the following for the XYZ store. 1. Open to buy for each month 2. Average monthly
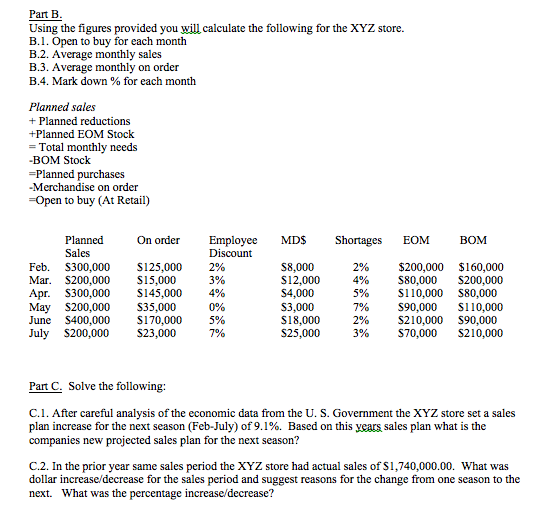
Part B.
Using the figures provided you will calculate the following for the XYZ store.
1. Open to buy for each month
2. Average monthly sales
3. Average monthly on order
4. Mark down % for each month
Planned sales
+ Planned reductions
+Planned EOM Stock
= Total monthly needs
-BOM Stock
=Planned purchases
-Merchandise on order
=Open to buy (At Retail)
Planned Sales On order EmployeeDiscount MD$ Shortages EOM BOM
Feb. $300,000 $125,000 2% $8,000 2% $200,000 $160,000
Mar. $200,000 $15,000 3% $12,000 4% $80,000 $200,000
Apr. $300,000 $145,000 4% $4,000 5% $110,000 $80,000
May $200,000 $35,000 0% $3,000 7% $90,000 $110,000
June $400,000 $170,000 5% $18,000 2% $210,000 $90,000
July $200,000 $23,000 7% $25,000 3% $70,000 $210,000
Part C. Solve the following:
1. After careful analysis of the economic data from the U. S. Government the XYZ store set a sales plan increase for the next season (Feb-July) of 9.1%. Based on this years sales plan what is the companies new projected sales plan for the next season?
2. In the prior year same sales period the XYZ store had actual sales of $1,740,000.00. What was dollar increase/decrease for the sales period and suggest reasons for the change from one season to the next. What was the percentage increase/decrease?
Part B. Using the figures provided you will calculate the following for the XYZ store. B.1. Open to buy for each month B.2. Average monthly sales B.3. Average monthly on order B.4. Mark down % for each month Planned sales + Planned reductions +Planned EOM Stock = Total monthly needs -BOM Stock =Planned purchases -Merchandise on order =Open to buy (At Retail) On order MD$ Shortages EOM BOM Planned Sales Feb, $300,000 Mar. S200,000 Apr. $300,000 May $200,000 June S400,000 July $200,000 Employee Discount 2% 3% 4% 0% 5% S125,000 S15,000 S145,000 S35,000 S170,000 $23,000 2% 4% 5% $8,000 $12,000 $4,000 S3,000 S18,000 $25,000 7% $200,000 $160,000 $80,000 S200,000 S110,000 $80,000 S90,000 $110,000 S210,000 $90,000 $70,000 S210,000 2% 3% 7% Part C. Solve the following: C.1. After careful analysis of the economic data from the U. S. Government the XYZ store set a sales plan increase for the next season (Feb-July) of 9.1%. Based on this years sales plan what is the companies new projected sales plan for the next season? C.2. In the prior year same sales period the XYZ store had actual sales of $1,740,000.00. What was dollar increase/decrease for the sales period and suggest reasons for the change from one season to the next. What was the percentage increase/decrease? Part B. Using the figures provided you will calculate the following for the XYZ store. B.1. Open to buy for each month B.2. Average monthly sales B.3. Average monthly on order B.4. Mark down % for each month Planned sales + Planned reductions +Planned EOM Stock = Total monthly needs -BOM Stock =Planned purchases -Merchandise on order =Open to buy (At Retail) On order MD$ Shortages EOM BOM Planned Sales Feb, $300,000 Mar. S200,000 Apr. $300,000 May $200,000 June S400,000 July $200,000 Employee Discount 2% 3% 4% 0% 5% S125,000 S15,000 S145,000 S35,000 S170,000 $23,000 2% 4% 5% $8,000 $12,000 $4,000 S3,000 S18,000 $25,000 7% $200,000 $160,000 $80,000 S200,000 S110,000 $80,000 S90,000 $110,000 S210,000 $90,000 $70,000 S210,000 2% 3% 7% Part C. Solve the following: C.1. After careful analysis of the economic data from the U. S. Government the XYZ store set a sales plan increase for the next season (Feb-July) of 9.1%. Based on this years sales plan what is the companies new projected sales plan for the next season? C.2. In the prior year same sales period the XYZ store had actual sales of $1,740,000.00. What was dollar increase/decrease for the sales period and suggest reasons for the change from one season to the next. What was the percentage increase/decreaseStep by Step Solution
There are 3 Steps involved in it
Step: 1

Get Instant Access to Expert-Tailored Solutions
See step-by-step solutions with expert insights and AI powered tools for academic success
Step: 2

Step: 3
Ace Your Homework with AI
Get the answers you need in no time with our AI-driven, step-by-step assistance
Get Started
Auditing Philosophy And Technique
Authors: John William Cook
1st Edition
039520660X, 978-0395206607