Part C: Break-Even Decisions
Return all assumptions to their initial (Part A) values, including returning sales growth back to the average of the previous two years, and returning SG&A/Sales and PPE/Sales back to the average of the previous 3 years. (The Undo button can do this quickly.)
Assume now that New England Corp. has determined that they cannot exceed $100 million in long-term debt. So they are looking for other ways to remedy the shortfall in financing. Determine what changes they would have to make under the following options:
Q7: What if they opt to remedy the shortfall by reducing sales growth? What is the highest growth rate they could achieve and not exceed the debt limit?[2] _________________
Q8: Return sales growth to its initial level (average of previous 2 years). Now suppose that they want to remedy the shortfall by cutting the dividend payout ratio. Will this get them under the debt ceiling? _________________
Q9: Return the dividend payout rate to its initial level (average of previous 3 years). Now suppose that they want to remedy the shortfall by using fixed assets more efficiently (i.e., by cutting PPE/Sales). Use Solver to find what PPE/Sales would have to be reduced to in order to stay under the debt ceiling.
Part E: Create a Chart
Now create a chart to provide a more visual representation of the information in your data table. Highlight the two rows and six columns that contain the growth rates and corresponding debt levels. Select Insert | Scatter and choose straight lines with markers for the sub-type. Next, add titles under Chart Tools | Layout (the chart must be selected first). A chart title would be something like Sensitivity of LT debt to growth rate, the x-axis title would be sales growth and the y-axis title would be LT debt in millions. Once youve finished, move and size the table to an appropriate location and shape.
Once your chart is completed, notice that it is also interactive; if you change assumptions in the model, the chart adjusts accordingly.
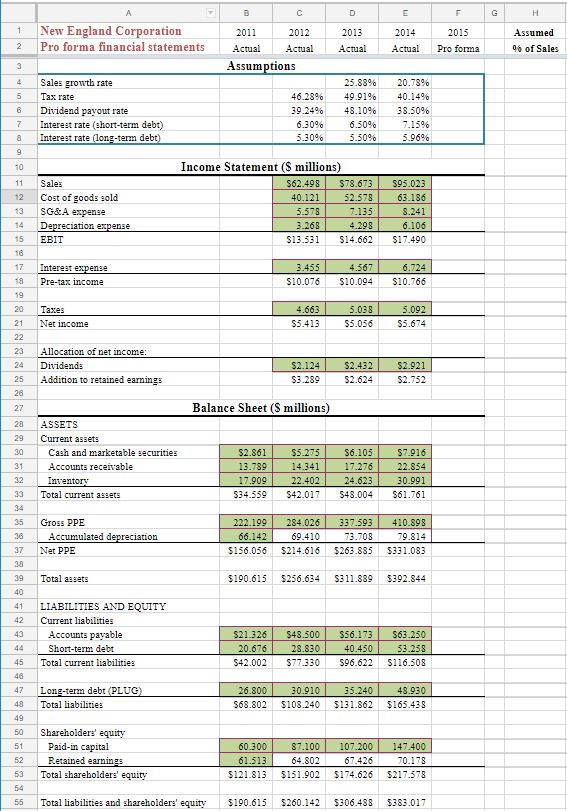
A B E F G H 1 New England Corporation Pro forma financial statements 2011 2012 Actual Actual Assumptions 2013 Actual 2014 Actual 2015 Pro forma Assumed 06 of Sales 2 3 4 5 6 Sales growth rate Tax rate Dividend payout rate Interest rate (Short-term debt) Interest rate (long-term debt) 46.2896 39.24% 6.30% 5.306 25.889 49.91% 48.10% 6.50% 5.50% 20.78% 40.14% 38.50% 7.15% 5.96% 7 8 9 10 11 12 Income Statement ($ millions) S62.498 $78.673 40.121 52.578 5.578 7.135 3.268 4.298 $13.531 $14.662 Sales Cost of goods sold SG&A expense Depreciation expense EBIT 13 $95.023 63.186 8.241 6.106 $17.490 14 15 18 17 18 Interest expense Pre-tax income 3.455 $10.076 4.567 $10.094 6.724 $10.766 Taxes Net income 4.663 $5.413 5.038 $5.056 5.092 $5.674 Allocation of net income: Dividends Addition to retained earnings $2.124 S3 289 $2.432 $2.624 $2.921 $2.752 25 Balance Sheet ($ millions) 28 29 ASSETS Current assets Cash and marketable securities Accounts receivable Inventory Total current assets 31 32 33 $2.861 13.789 17.909 $34.559 $3.275 14.341 22.402 $42.017 $6.105 17.276 24.623 $48.004 $7.916 22.854 30.991 $61.761 35 38 Gross PPE Accumulated depreciation Net PPE 222.199 66.142 $156.056 284.026 69.410 $214.616 337.593 73.708 $263.885 410.898 79.814 $331.083 37 38 39 Total assets $190.615 $256.634 S311.889 5392.844 40 41 42 43 LIABILITIES AND EQUITY Current liabilities Accounts payable Short-term debt Total current liabilities 44 $21.326 20.676 $42.002 $48.500 28.830 $77.330 $56.173 40.450 S96.622 563.250 53.258 $116.508 45 48 47 48 Long-term debt (PLUG Total liabilities 26.800 $68.802 30.910 $108.240 35.240 $131.862 48.930 $165.438 50 51 Shareholders' equity Paid-in capital Retained earnings Total shareholders' equity 60.300 61.513 $121.813 87.100 64.802 $151.902 107.200 67.426 $174.626 147.400 70.178 $217.578 53 54 55 Total liabilities and shareholders' equity $190.615 $260.142 $306.488 $383.017 A B E F G H 1 New England Corporation Pro forma financial statements 2011 2012 Actual Actual Assumptions 2013 Actual 2014 Actual 2015 Pro forma Assumed 06 of Sales 2 3 4 5 6 Sales growth rate Tax rate Dividend payout rate Interest rate (Short-term debt) Interest rate (long-term debt) 46.2896 39.24% 6.30% 5.306 25.889 49.91% 48.10% 6.50% 5.50% 20.78% 40.14% 38.50% 7.15% 5.96% 7 8 9 10 11 12 Income Statement ($ millions) S62.498 $78.673 40.121 52.578 5.578 7.135 3.268 4.298 $13.531 $14.662 Sales Cost of goods sold SG&A expense Depreciation expense EBIT 13 $95.023 63.186 8.241 6.106 $17.490 14 15 18 17 18 Interest expense Pre-tax income 3.455 $10.076 4.567 $10.094 6.724 $10.766 Taxes Net income 4.663 $5.413 5.038 $5.056 5.092 $5.674 Allocation of net income: Dividends Addition to retained earnings $2.124 S3 289 $2.432 $2.624 $2.921 $2.752 25 Balance Sheet ($ millions) 28 29 ASSETS Current assets Cash and marketable securities Accounts receivable Inventory Total current assets 31 32 33 $2.861 13.789 17.909 $34.559 $3.275 14.341 22.402 $42.017 $6.105 17.276 24.623 $48.004 $7.916 22.854 30.991 $61.761 35 38 Gross PPE Accumulated depreciation Net PPE 222.199 66.142 $156.056 284.026 69.410 $214.616 337.593 73.708 $263.885 410.898 79.814 $331.083 37 38 39 Total assets $190.615 $256.634 S311.889 5392.844 40 41 42 43 LIABILITIES AND EQUITY Current liabilities Accounts payable Short-term debt Total current liabilities 44 $21.326 20.676 $42.002 $48.500 28.830 $77.330 $56.173 40.450 S96.622 563.250 53.258 $116.508 45 48 47 48 Long-term debt (PLUG Total liabilities 26.800 $68.802 30.910 $108.240 35.240 $131.862 48.930 $165.438 50 51 Shareholders' equity Paid-in capital Retained earnings Total shareholders' equity 60.300 61.513 $121.813 87.100 64.802 $151.902 107.200 67.426 $174.626 147.400 70.178 $217.578 53 54 55 Total liabilities and shareholders' equity $190.615 $260.142 $306.488 $383.017