Answered step by step
Verified Expert Solution
Question
1 Approved Answer
Part C & D need to be answered for studying purposes. Question 1 The Boston Bar Chocolate Company (BBCC) is a privately owned business that
Part C & D need to be answered for studying purposes.
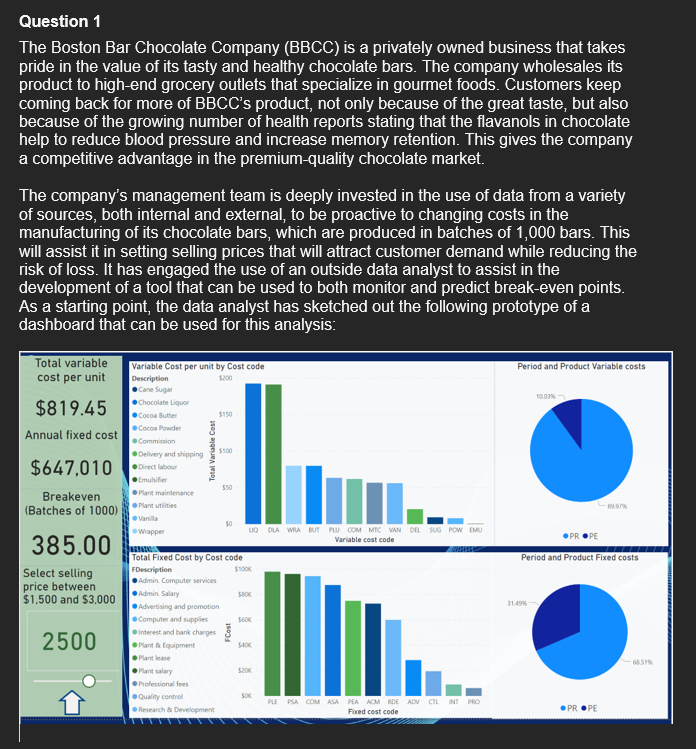
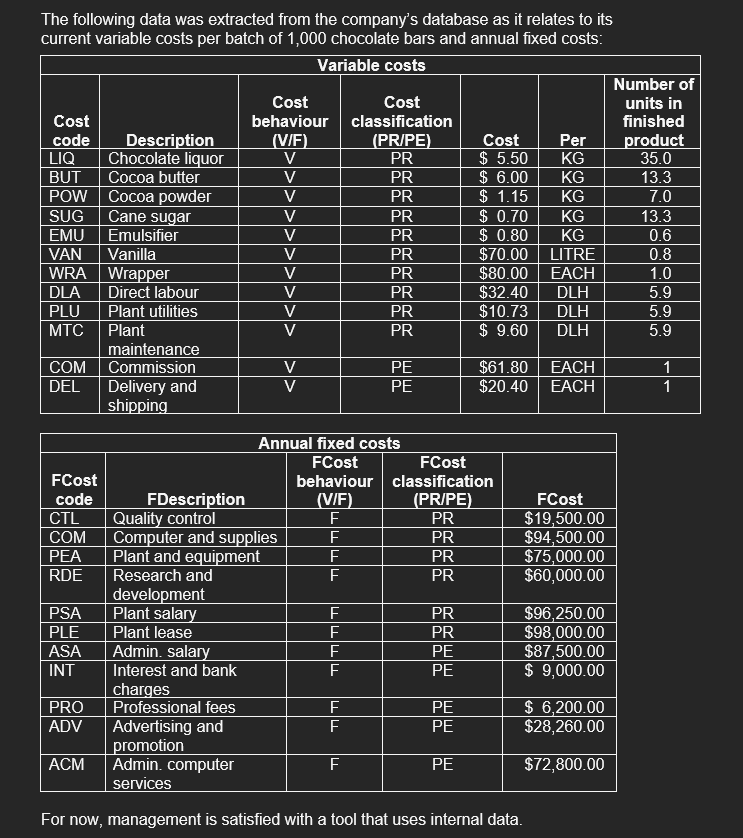
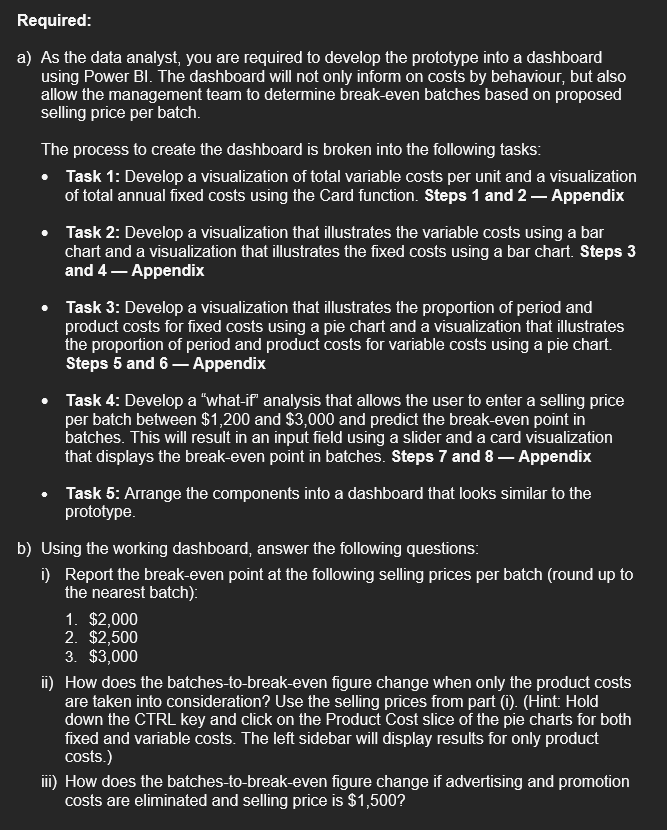
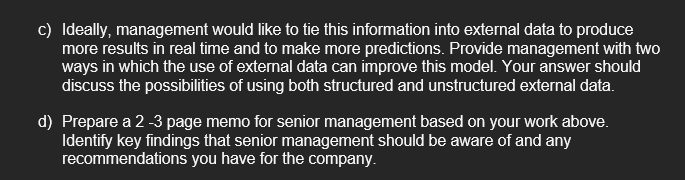
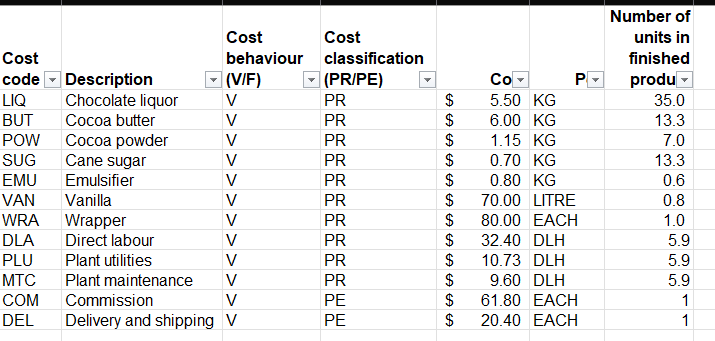
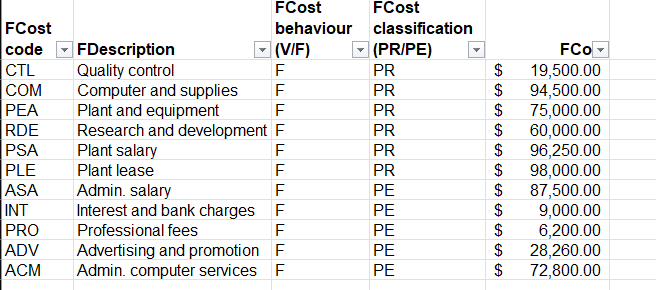
Question 1 The Boston Bar Chocolate Company (BBCC) is a privately owned business that takes pride in the value of its tasty and healthy chocolate bars. The company wholesales its product to high-end grocery outlets that specialize in gourmet foods. Customers keep coming back for more of BBCC's product, not only because of the great taste, but also because of the growing number of health reports stating that the flavanols in chocolate help to reduce blood pressure and increase memory retention. This gives the company a competitive advantage in the premium-quality chocolate market. The company's management team is deeply invested in the use of data from a variety of sources, both internal and external, to be proactive to changing costs in the manufacturing of its chocolate bars, which are produced in batches of 1,000 bars. This will assist it in setting selling prices that will attract customer demand while reducing the risk of loss. It has engaged the use of an outside data analyst to assist in the development of a tool that can be used to both monitor and predict break-even points. As a starting point, the data analyst has sketched out the following prototype of a dashboard that can be used for this analysis: Total variable cost per unit Period and Product Variable costs 10:03 $819.45 Variable Cost per unit by Costcode Description Cane Sugar Chocolate Liquor Cocoa Butter 5150 Cocoa Powder 3 Commission Delivery and shipping $100 Annual fixed cost Total Variable Cost $647,010 viet labou Breakeven (Batches of 1000) 1997 PROPE Period and Product Fixed costs 385.00 Select selling price between $1,500 and $3,000 Emulsifier 550 Plant maintenance Plant utilities Vanita $0 Wrapper LO DLA WA BUT PU COM MIC WORL SUG POWEMU Variable costcode Total Fixed Cost by Cost code FDescription Admin Computer services Admin Salary SBOK Advertising and promotion Computer and supplies SEOK Interest and bank charges Punt & Equipment SOK Plantas Plant salary $20K Professional fees Quality control SOK PLEPSA COM ASA PEA ACM RDE ADV CILIN PRO Research & Development Fored costcode 31493 150 2500 .PROPE The following data was extracted from the company's database as it relates to its current variable costs per batch of 1,000 chocolate bars and annual fixed costs: Variable costs Number of Cost Cost units in Cost behaviour classification finished code Description (V/F) (PR/PE) Cost Per product LIQ Chocolate liquor V PR $ 5.50 KG 35.0 BUT Cocoa butter V PR $ 6.00 KG 13.3 POW Cocoa powder V PR $ 1.15 KG 7.0 SUG Cane sugar V PR $ 0.70 KG 13.3 EMU Emulsifier V PR $ 0.80 KG 0.6 VAN Vanilla V PR $70.00 LITRE 0.8 WRA Wrapper V PR $80.00 EACH 1.0 DLA Direct labour V PR $32.40 DLH 5.9 PLU Plant utilities V PR $10.73 DLH 5.9 MTC Plant V PR $ 9.60 DLH 5.9 maintenance COM Commission V PE $61.80 EACH 1 DEL Delivery and V PE $20.40 EACH 1 shipping FCost code CTL COM PEA RDE lll LLLLLLLL FCost $19,500.00 $94,500.00 $75,000.00 $60,000.00 PSA PLE ASA INT Annual fixed costs FCost FCost behaviour classification FDescription (VIF) (PR/PE) Quality control F PR Computer and supplies PR Plant and equipment F PR Research and E PR development Plant salary_ F PR Plant lease F PR Admin, salary PE Interest and bank PE charges Professional fees PE Advertising and PE promotion Admin, computer F. services |||| $96,250.00 $98,000.00 $87,500.00 $ 9,000.00 PRO ADV E $ 6,200.00 $28,260.00 ACM $72,800.00 For now, management is satisfied with a tool that uses internal data. Required: a) As the data analyst, you are required to develop the prototype into a dashboard using Power BI. The dashboard will not only inform on costs by behaviour, but also allow the management team to determine break-even batches based on proposed selling price per batch. The process to create the dashboard is broken into the following tasks: Task 1: Develop a visualization of total variable costs per unit and a visualization of total annual fixed costs using the Card function. Steps 1 and 2 Appendix Task 2: Develop a visualization that illustrates the variable costs using a bar chart and a visualization that illustrates the fixed costs using a bar chart. Steps 3 and 4 Appendix Task 3: Develop a visualization that illustrates the proportion of period and product costs for fixed costs using a pie chart and a visualization that illustrates the proportion of period and product costs for variable costs using a pie chart. Steps 5 and 6 Appendix Task 4: Develop a "what-if analysis that allows the user to enter a selling price per batch between $1,200 and $3,000 and predict the break-even point in batches. This will result in an input field using a slider and a card visualization that displays the break-even point in batches. Steps 7 and 8 Appendix Task 5: Arrange the components into a dashboard that looks similar to the prototype. b) Using the working dashboard, answer the following questions: i) Report the break-even point at the following selling prices per batch (round up to the nearest batch): 1. $2,000 2. $2,500 3. $3,000 ii) How does the batches-to-break-even figure change when only the product costs are taken into consideration? Use the selling prices from part (1). (Hint: Hold down the CTRL key and click on the Product Cost slice of the pie charts for both fixed and variable costs. The left sidebar will display results for only product costs.) iii) How does the batches-to-break-even figure change if advertising and promotion costs are eliminated and selling price is $1,500? C) Ideally, management would like to tie this information into external data to produce more results in real time and to make more predictions. Provide management with two ways in which the use of external data can improve this model. Your answer should discuss the possibilities of using both structured and unstructured external data. d) Prepare a 2-3 page memo for senior management based on your work above. Identify key findings that senior management should be aware of and any recommendations you have for the company. Cost Cost Cost behaviour classification code Description (VIF) (PR/PE) LIQ Chocolate liquor V PR BUT Cocoa butter V PR POW Cocoa powder PR SUG Cane sugar V PR EMU Emulsifier VAN Vanilla V PR WRA Wrapper PR DLA Direct labour V PR PLU Plant utilities V PR MTC Plant maintenance V PR COM Commission V PE DEL Delivery and shipping V PE $ $ $ $ $ $ $ $ $ $ $ $ PR Number of units in finished produ 35.0 13.3 7.0 13.3 0.6 0.8 1.0 5.9 5.9 5.9 1 1 Co P 5.50 KG 6.00 KG 1.15 KG 0.70 KG 0.80 KG 70.00 LITRE 80.00 EACH 32.40 DLH 10.73 DLH 9.60 DLH 61.80 EACH 20.40 EACH FCost code CTL COM PEA RDE PSA PLE ASA INT PRO ADV ACM FCost FCost behaviour classification FDescription (VIF) (PR/PE) Quality control F PR Computer and supplies F PR Plant and equipment F PR Research and development F PR Plant salary F PR Plant lease F PR Admin. salary F PE Interest and bank charges F PE Professional fees F PE Advertising and promotion F PE Admin. computer services F PE A A A A A A A A A A A FCO 19,500.00 94,500.00 75,000.00 60,000.00 96,250.00 98,000.00 87,500.00 9,000.00 6,200.00 28,260.00 72,800.00 $ Question 1 The Boston Bar Chocolate Company (BBCC) is a privately owned business that takes pride in the value of its tasty and healthy chocolate bars. The company wholesales its product to high-end grocery outlets that specialize in gourmet foods. Customers keep coming back for more of BBCC's product, not only because of the great taste, but also because of the growing number of health reports stating that the flavanols in chocolate help to reduce blood pressure and increase memory retention. This gives the company a competitive advantage in the premium-quality chocolate market. The company's management team is deeply invested in the use of data from a variety of sources, both internal and external, to be proactive to changing costs in the manufacturing of its chocolate bars, which are produced in batches of 1,000 bars. This will assist it in setting selling prices that will attract customer demand while reducing the risk of loss. It has engaged the use of an outside data analyst to assist in the development of a tool that can be used to both monitor and predict break-even points. As a starting point, the data analyst has sketched out the following prototype of a dashboard that can be used for this analysis: Total variable cost per unit Period and Product Variable costs 10:03 $819.45 Variable Cost per unit by Costcode Description Cane Sugar Chocolate Liquor Cocoa Butter 5150 Cocoa Powder 3 Commission Delivery and shipping $100 Annual fixed cost Total Variable Cost $647,010 viet labou Breakeven (Batches of 1000) 1997 PROPE Period and Product Fixed costs 385.00 Select selling price between $1,500 and $3,000 Emulsifier 550 Plant maintenance Plant utilities Vanita $0 Wrapper LO DLA WA BUT PU COM MIC WORL SUG POWEMU Variable costcode Total Fixed Cost by Cost code FDescription Admin Computer services Admin Salary SBOK Advertising and promotion Computer and supplies SEOK Interest and bank charges Punt & Equipment SOK Plantas Plant salary $20K Professional fees Quality control SOK PLEPSA COM ASA PEA ACM RDE ADV CILIN PRO Research & Development Fored costcode 31493 150 2500 .PROPE The following data was extracted from the company's database as it relates to its current variable costs per batch of 1,000 chocolate bars and annual fixed costs: Variable costs Number of Cost Cost units in Cost behaviour classification finished code Description (V/F) (PR/PE) Cost Per product LIQ Chocolate liquor V PR $ 5.50 KG 35.0 BUT Cocoa butter V PR $ 6.00 KG 13.3 POW Cocoa powder V PR $ 1.15 KG 7.0 SUG Cane sugar V PR $ 0.70 KG 13.3 EMU Emulsifier V PR $ 0.80 KG 0.6 VAN Vanilla V PR $70.00 LITRE 0.8 WRA Wrapper V PR $80.00 EACH 1.0 DLA Direct labour V PR $32.40 DLH 5.9 PLU Plant utilities V PR $10.73 DLH 5.9 MTC Plant V PR $ 9.60 DLH 5.9 maintenance COM Commission V PE $61.80 EACH 1 DEL Delivery and V PE $20.40 EACH 1 shipping FCost code CTL COM PEA RDE lll LLLLLLLL FCost $19,500.00 $94,500.00 $75,000.00 $60,000.00 PSA PLE ASA INT Annual fixed costs FCost FCost behaviour classification FDescription (VIF) (PR/PE) Quality control F PR Computer and supplies PR Plant and equipment F PR Research and E PR development Plant salary_ F PR Plant lease F PR Admin, salary PE Interest and bank PE charges Professional fees PE Advertising and PE promotion Admin, computer F. services |||| $96,250.00 $98,000.00 $87,500.00 $ 9,000.00 PRO ADV E $ 6,200.00 $28,260.00 ACM $72,800.00 For now, management is satisfied with a tool that uses internal data. Required: a) As the data analyst, you are required to develop the prototype into a dashboard using Power BI. The dashboard will not only inform on costs by behaviour, but also allow the management team to determine break-even batches based on proposed selling price per batch. The process to create the dashboard is broken into the following tasks: Task 1: Develop a visualization of total variable costs per unit and a visualization of total annual fixed costs using the Card function. Steps 1 and 2 Appendix Task 2: Develop a visualization that illustrates the variable costs using a bar chart and a visualization that illustrates the fixed costs using a bar chart. Steps 3 and 4 Appendix Task 3: Develop a visualization that illustrates the proportion of period and product costs for fixed costs using a pie chart and a visualization that illustrates the proportion of period and product costs for variable costs using a pie chart. Steps 5 and 6 Appendix Task 4: Develop a "what-if analysis that allows the user to enter a selling price per batch between $1,200 and $3,000 and predict the break-even point in batches. This will result in an input field using a slider and a card visualization that displays the break-even point in batches. Steps 7 and 8 Appendix Task 5: Arrange the components into a dashboard that looks similar to the prototype. b) Using the working dashboard, answer the following questions: i) Report the break-even point at the following selling prices per batch (round up to the nearest batch): 1. $2,000 2. $2,500 3. $3,000 ii) How does the batches-to-break-even figure change when only the product costs are taken into consideration? Use the selling prices from part (1). (Hint: Hold down the CTRL key and click on the Product Cost slice of the pie charts for both fixed and variable costs. The left sidebar will display results for only product costs.) iii) How does the batches-to-break-even figure change if advertising and promotion costs are eliminated and selling price is $1,500? C) Ideally, management would like to tie this information into external data to produce more results in real time and to make more predictions. Provide management with two ways in which the use of external data can improve this model. Your answer should discuss the possibilities of using both structured and unstructured external data. d) Prepare a 2-3 page memo for senior management based on your work above. Identify key findings that senior management should be aware of and any recommendations you have for the company. Cost Cost Cost behaviour classification code Description (VIF) (PR/PE) LIQ Chocolate liquor V PR BUT Cocoa butter V PR POW Cocoa powder PR SUG Cane sugar V PR EMU Emulsifier VAN Vanilla V PR WRA Wrapper PR DLA Direct labour V PR PLU Plant utilities V PR MTC Plant maintenance V PR COM Commission V PE DEL Delivery and shipping V PE $ $ $ $ $ $ $ $ $ $ $ $ PR Number of units in finished produ 35.0 13.3 7.0 13.3 0.6 0.8 1.0 5.9 5.9 5.9 1 1 Co P 5.50 KG 6.00 KG 1.15 KG 0.70 KG 0.80 KG 70.00 LITRE 80.00 EACH 32.40 DLH 10.73 DLH 9.60 DLH 61.80 EACH 20.40 EACH FCost code CTL COM PEA RDE PSA PLE ASA INT PRO ADV ACM FCost FCost behaviour classification FDescription (VIF) (PR/PE) Quality control F PR Computer and supplies F PR Plant and equipment F PR Research and development F PR Plant salary F PR Plant lease F PR Admin. salary F PE Interest and bank charges F PE Professional fees F PE Advertising and promotion F PE Admin. computer services F PE A A A A A A A A A A A FCO 19,500.00 94,500.00 75,000.00 60,000.00 96,250.00 98,000.00 87,500.00 9,000.00 6,200.00 28,260.00 72,800.00 $Step by Step Solution
There are 3 Steps involved in it
Step: 1

Get Instant Access to Expert-Tailored Solutions
See step-by-step solutions with expert insights and AI powered tools for academic success
Step: 2

Step: 3
Ace Your Homework with AI
Get the answers you need in no time with our AI-driven, step-by-step assistance
Get Started