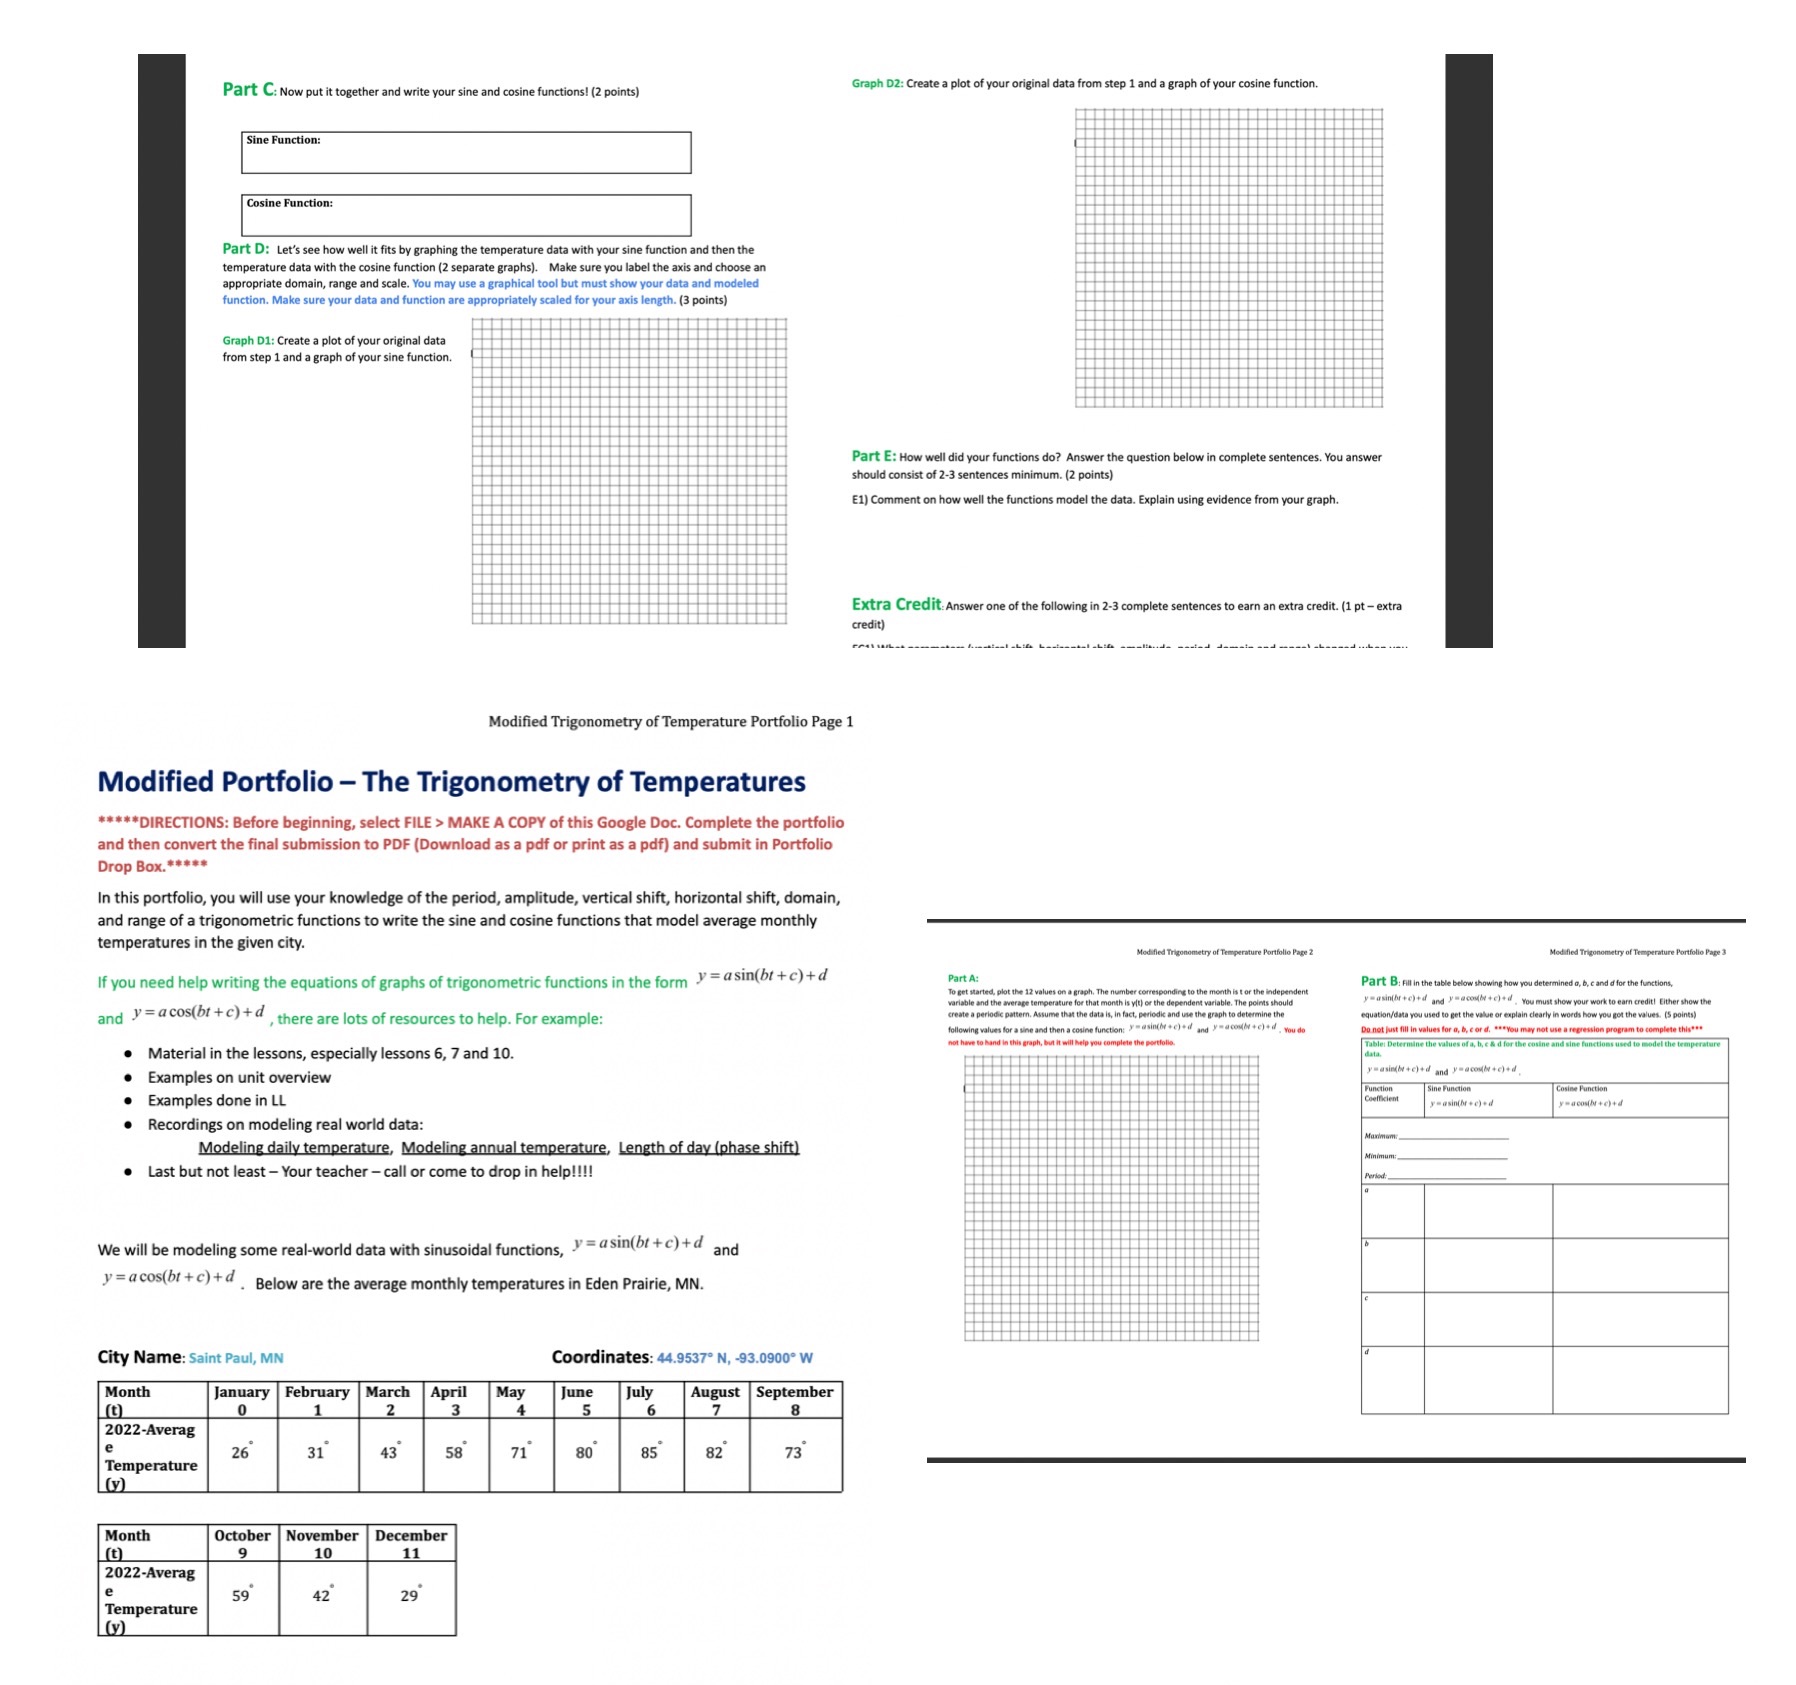
Part C: Now put it together and write your sine and cosine functions! (2 points) Graph D2: Create a plot of your original data from step 1 and a graph of your cosine function. Sine Function Cosine Function: Part D: Let's see how well it fits by graphing the temperature data with your sine function and then the temperature date when the cosme function to separate greens)- make sure you label the axis and choose an function. Make sure your data and function are appropriately scaled for your axis length. (3 points) Graph D1: Create a plot of your original data from step 1 and a graph of your sine function. Part E: How well did your functions do? Answer the question below in complete sentences. You answer should consist of 2-3 sentences minimum. (2 points) E1) Comment on how well the functions model the data. Explain using evidence from your graph. Extra Credit: Answer one of the following in 2-3 complete sentences to earn an extra credit. (1 pt - extra credit) Modified Trigonometry of Temperature Portfolio Page 1 Modified Portfolio - The Trigonometry of Temperatures *****DIRECTIONS: Before beginning, select FILE > MAKE A COPY of this Google Doc. Complete the portfolio and then convert the final submission to PDF (Download as a pdf or print as a pdf) and submit in Portfolio Drop Box.*** In this portfolio, you will use your knowledge of the period, amplitude, vertical shift, horizontal shift, domain, and range of a trigonometric functions to write the sine and cosine functions that model average monthly temperatures in the given city. if you need help writing the equations of graphs of trigonometric functions in the form ) = asin(bt + c) +d Part A: To get started, plot the 12 values on a graph. The number corresponding to the month is t or the independent Part B: fill in the table below showing how you determined a, b, c and of for the functions, create a periodic pattern. Assume that the data is, in fact, periodic and use the graph to determine the yasin(br +c)+d and y" acau by + c)+4 . You must show your work to earn credit! Either show th and y = a cos(bi + c) +d , there are lots of resources to help. For example: lowing values for a sine and then a cosine function: " " a sing "led and y macombs +c)ed Material in the lessons, especially lessons 6, 7 and 10. Tablet Determine the values of a, b, c & d for the cosine and sine functions used to model the temperature Examples on unit overview Examples done in LL function Recordings on modeling real world data: Modeling daily temperature, Modeling annual temperature, Length of day (phase shift) . Last but not least - Your teacher - call or come to drop in help! We will be modeling some real-world data with sinusoidal functions, Yasin(bi +c)+d and y = acos(bt + c)+d . Below are the average monthly temperatures in Eden Prairie, MN. City Name: Saint Paul, MN Coordinates: 44.9537 N, -93.0900 W Month ry February March April May June July August September (t) 2022-Averag 26 31 71 85 82 73 Temperature (y) Month October November December (t) 2022-Averag 59 12 29 Temperature (y)