Answered step by step
Verified Expert Solution
Link Copied!

Question

1 Approved Answer

(Part Carter Company reported these income statement data for a 2-year period. 2017 2016 $250,000 $210,000 40,000 30,000 202,000 173,000 Cost of goods available for
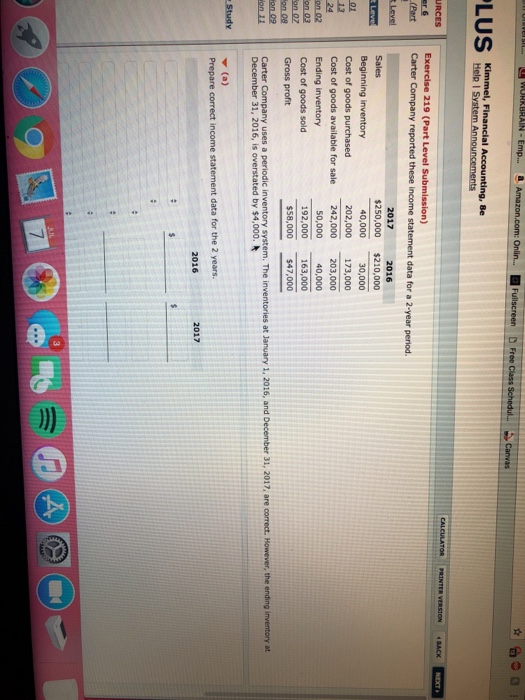
image text in transcribed
(Part Carter Company reported these income statement data for a 2-year period. 2017 2016 $250,000 $210,000 40,000 30,000 202,000 173,000 Cost of goods available for sale 242,000 203,000 so,000 40,000 192,000 163,000 $58,000 47,000 Beginning inventory Cost of goods purchased Ending inventory Cost of goods sold Gross profit Stud() Prepare correct income statement data for the 2 years. 2016 2017

Step by Step Solution

There are 3 Steps involved in it

Step: 1

blur-text-image

Get Instant Access to Expert-Tailored Solutions

See step-by-step solutions with expert insights and AI powered tools for academic success

Step: 2

blur-text-image

Step: 3

blur-text-image

Ace Your Homework with AI

Get the answers you need in no time with our AI-driven, step-by-step assistance

Get Started

Recommended Textbook for

Audit Culture How Indicators And Rankings Are Reshaping The World

Authors: Cris Shore, Susan Wright

1st Edition

0745336450, 978-0745336459

More Books

Students also viewed these Accounting questions