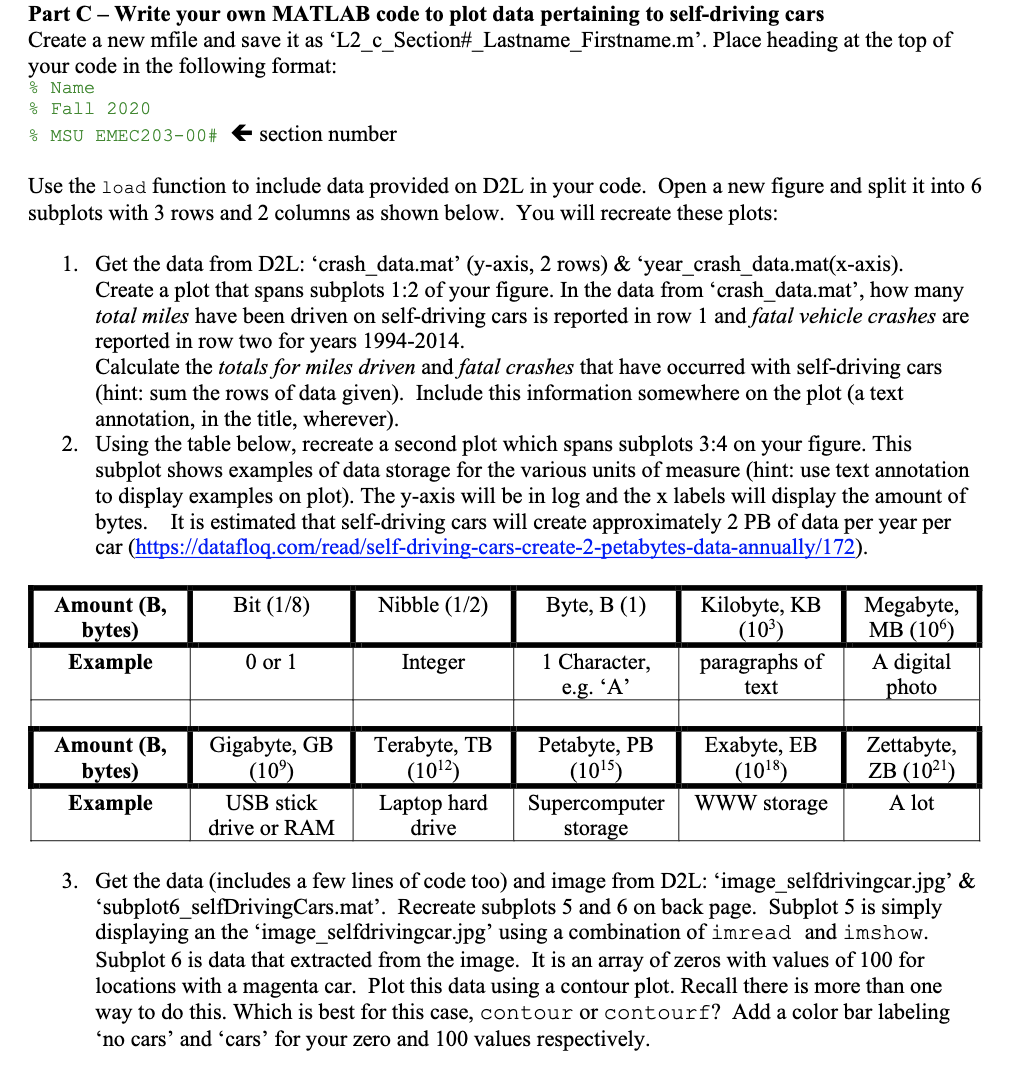
Part C-Write your own MATLAB code to plot data pertaining to self-driving cars Create a new mfile and save it as L2_c_Section#_Lastname_Firstname.m'. Place heading at the top of your code in the following format: % Name % Fall 2020 8 MSU EMEC203-00# section number Use the load function to include data provided on D2L in your code. Open a new figure and split it into 6 subplots with 3 rows and 2 columns as shown below. You will recreate these plots: 1. Get the data from D2L: crash_data.mat' (y-axis, 2 rows) & year_crash_data.mat(x-axis). Create a plot that spans subplots 1:2 of your figure. In the data from crash_data.mat, how many total miles have been driven on self-driving cars is reported in row 1 and fatal vehicle crashes are reported in row two for years 1994-2014. Calculate the totals for miles driven and fatal crashes that have occurred with self-driving cars (hint: sum the rows of data given). Include this information somewhere on the plot (a text annotation, in the title, wherever). 2. Using the table below, recreate a second plot which spans subplots 3:4 on your figure. This subplot shows examples of data storage for the various units of measure (hint: use text annotation to display examples on plot). The y-axis will be in log and the x labels will display the amount of bytes. It is estimated that self-driving cars will create approximately 2 PB of data per year per car (https://datafloq.com/read/self-driving-cars-create-2-petabytes-data-annually/172). Bit (1/8) Nibble (1/2) Byte, B (1) Amount (B, bytes) Example Kilobyte, KB (10) paragraphs of text Megabyte, MB (106) A digital 0 or 1 Integer 1 Character, e.g. 'A' photo Amount (B, bytes) Example Gigabyte, GB (109) USB stick drive or RAM Terabyte, TB (1012) Laptop hard drive Exabyte, EB (1018) Petabyte, PB (1015) Supercomputer storage Zettabyte, ZB (1021) A lot WWW storage 3. Get the data (includes a few lines of code too) and image from D2L: `image_selfdrivingcar.jpg' & subplot6_selfDrivingCars.mat'. Recreate subplots 5 and 6 on back page. Subplot 5 is simply displaying an the `image_selfdrivingcar.jpg' using a combination of imread and imshow. Subplot 6 is data that extracted from the image. It is an array of zeros with values of 100 for locations with a magenta car. Plot this data using a contour plot. Recall there is more than one way to do this. Which is best for this case, contour or contourf? Add a color bar labeling no cars' and 'cars' for your zero and 100 values respectively. Part C-Write your own MATLAB code to plot data pertaining to self-driving cars Create a new mfile and save it as L2_c_Section#_Lastname_Firstname.m'. Place heading at the top of your code in the following format: % Name % Fall 2020 8 MSU EMEC203-00# section number Use the load function to include data provided on D2L in your code. Open a new figure and split it into 6 subplots with 3 rows and 2 columns as shown below. You will recreate these plots: 1. Get the data from D2L: crash_data.mat' (y-axis, 2 rows) & year_crash_data.mat(x-axis). Create a plot that spans subplots 1:2 of your figure. In the data from crash_data.mat, how many total miles have been driven on self-driving cars is reported in row 1 and fatal vehicle crashes are reported in row two for years 1994-2014. Calculate the totals for miles driven and fatal crashes that have occurred with self-driving cars (hint: sum the rows of data given). Include this information somewhere on the plot (a text annotation, in the title, wherever). 2. Using the table below, recreate a second plot which spans subplots 3:4 on your figure. This subplot shows examples of data storage for the various units of measure (hint: use text annotation to display examples on plot). The y-axis will be in log and the x labels will display the amount of bytes. It is estimated that self-driving cars will create approximately 2 PB of data per year per car (https://datafloq.com/read/self-driving-cars-create-2-petabytes-data-annually/172). Bit (1/8) Nibble (1/2) Byte, B (1) Amount (B, bytes) Example Kilobyte, KB (10) paragraphs of text Megabyte, MB (106) A digital 0 or 1 Integer 1 Character, e.g. 'A' photo Amount (B, bytes) Example Gigabyte, GB (109) USB stick drive or RAM Terabyte, TB (1012) Laptop hard drive Exabyte, EB (1018) Petabyte, PB (1015) Supercomputer storage Zettabyte, ZB (1021) A lot WWW storage 3. Get the data (includes a few lines of code too) and image from D2L: `image_selfdrivingcar.jpg' & subplot6_selfDrivingCars.mat'. Recreate subplots 5 and 6 on back page. Subplot 5 is simply displaying an the `image_selfdrivingcar.jpg' using a combination of imread and imshow. Subplot 6 is data that extracted from the image. It is an array of zeros with values of 100 for locations with a magenta car. Plot this data using a contour plot. Recall there is more than one way to do this. Which is best for this case, contour or contourf? Add a color bar labeling no cars' and 'cars' for your zero and 100 values respectively