

Answered step by step
Verified Expert Solution
Question
1 Approved Answer
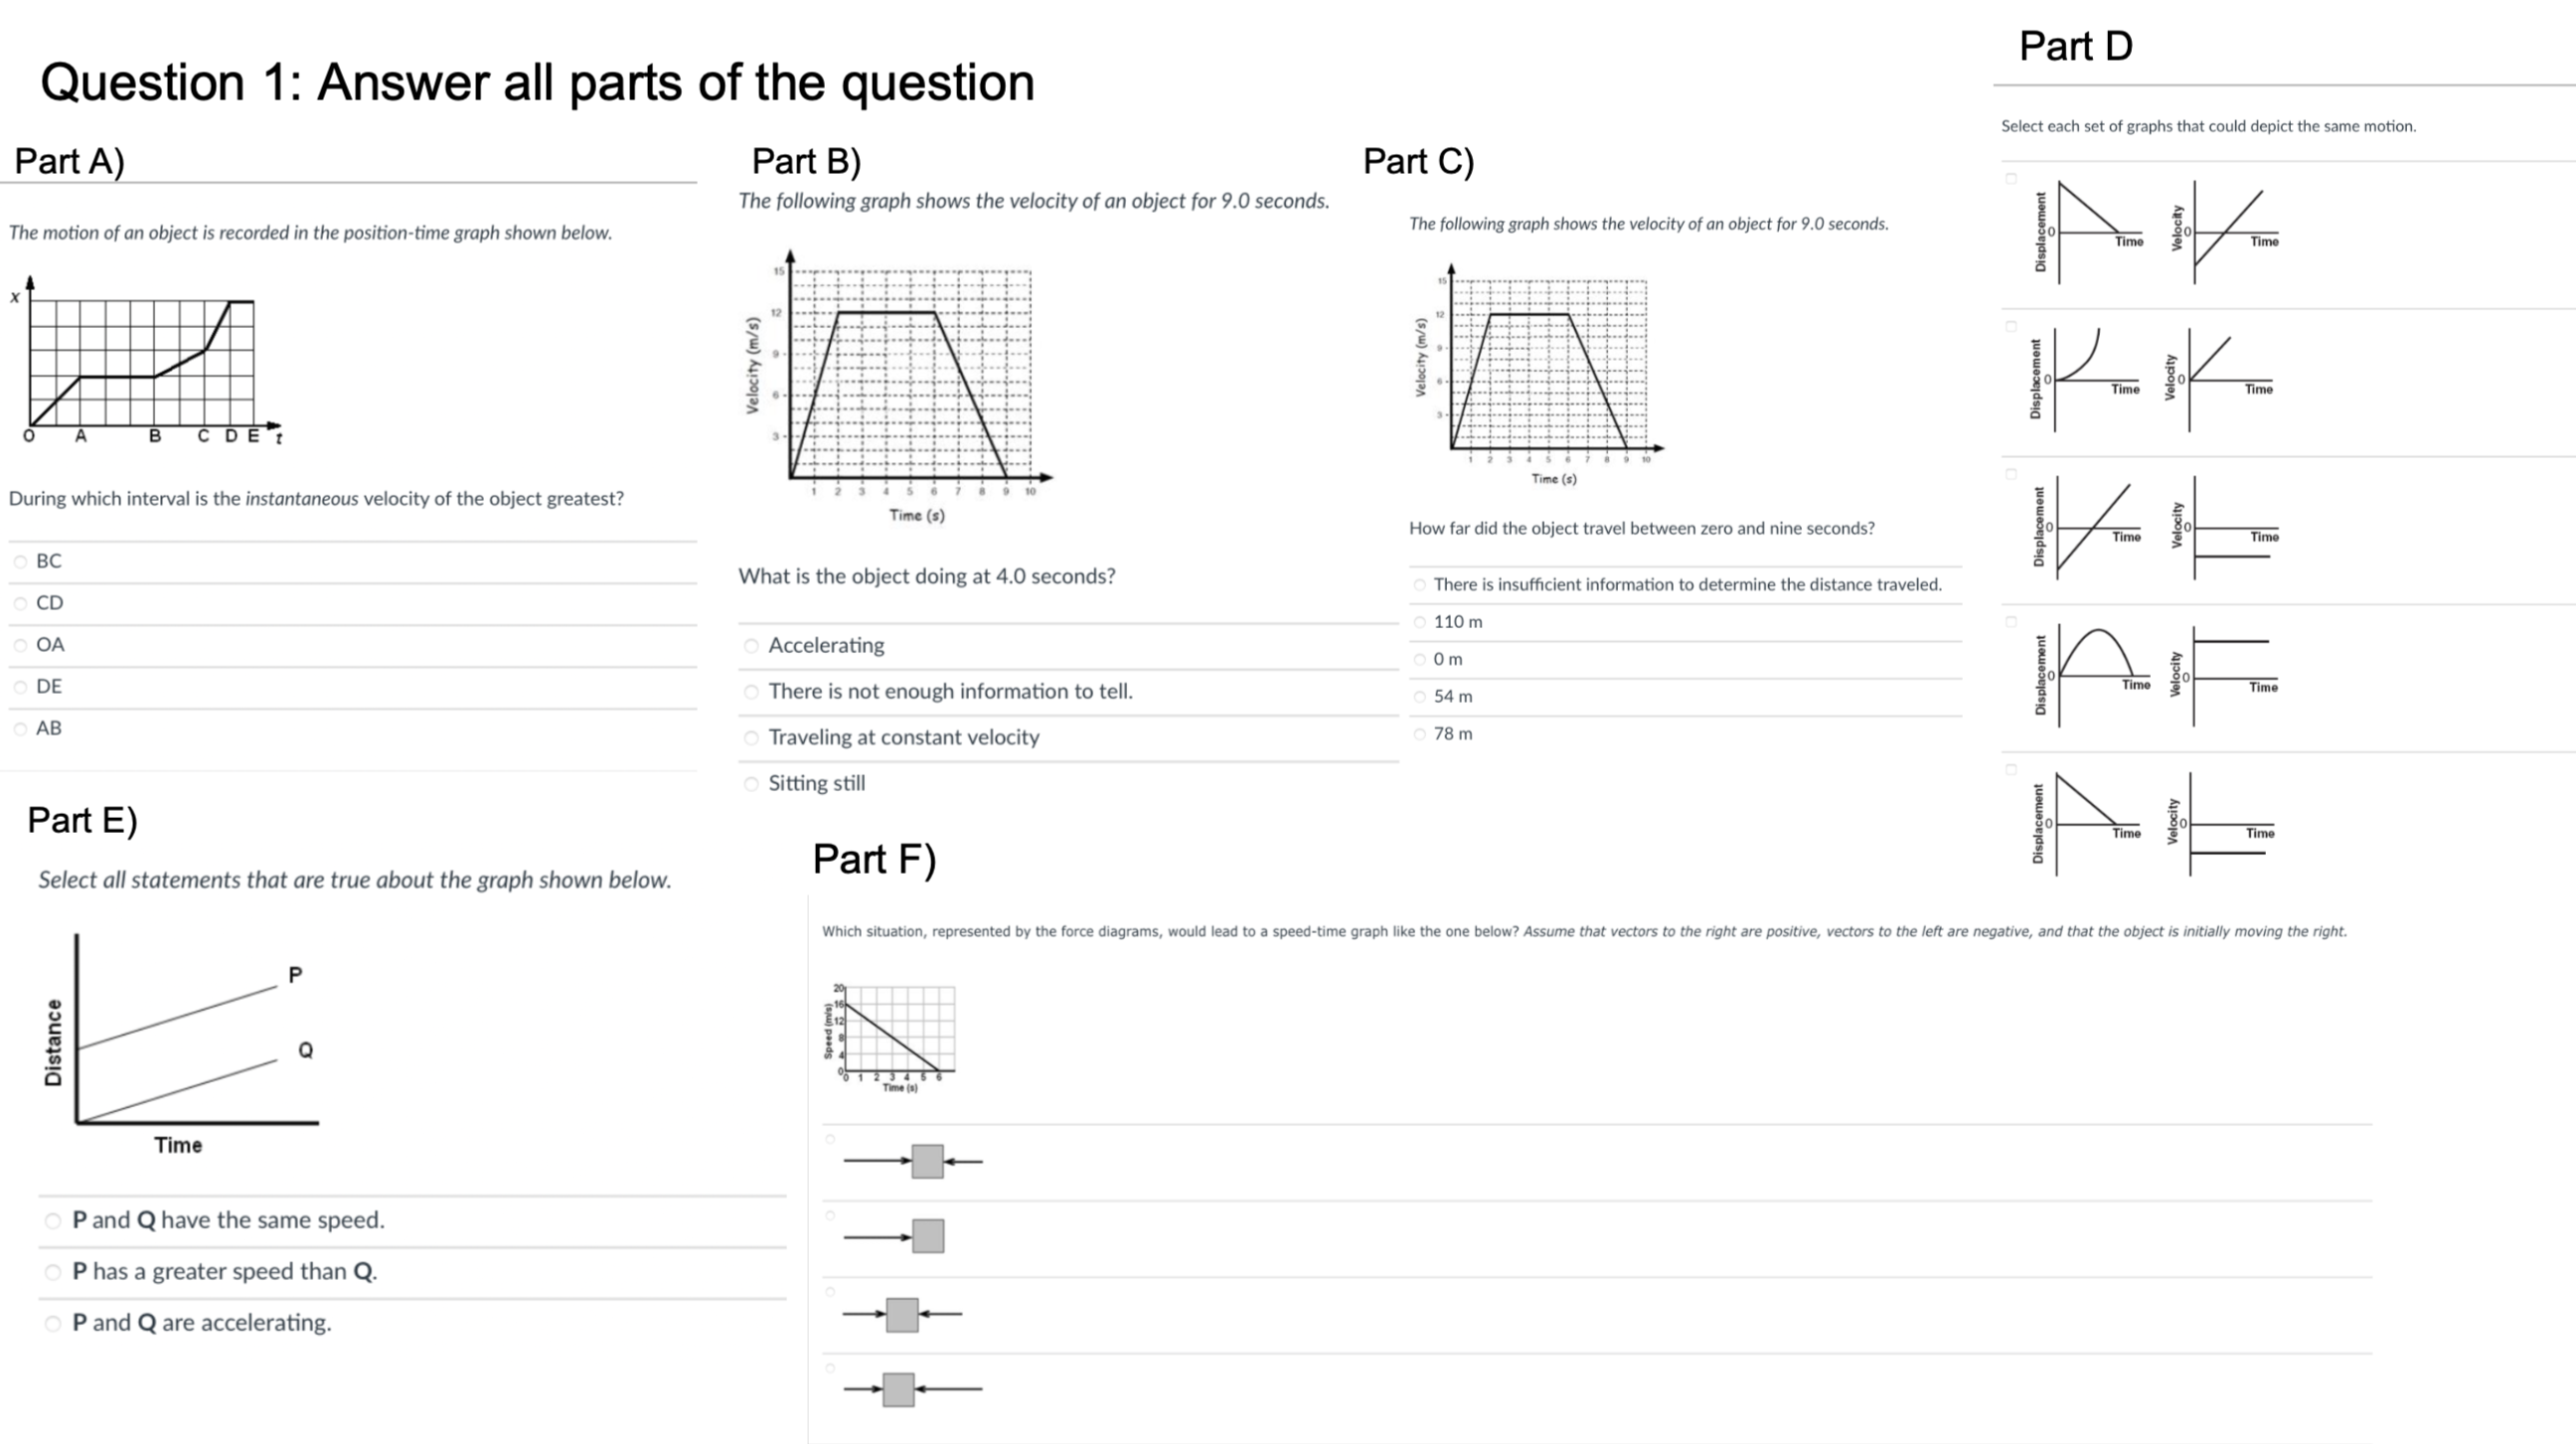
Part D Question 1: Answer all parts of the question Select each set of graphs that could depict the same motion. Part A) Part B)
Step by Step Solution
There are 3 Steps involved in it
Step: 1

Get Instant Access to Expert-Tailored Solutions
See step-by-step solutions with expert insights and AI powered tools for academic success
Step: 2

Step: 3
Ace Your Homework with AI
Get the answers you need in no time with our AI-driven, step-by-step assistance
Get Started
Introduction to Solid State Physics
Authors: Charles Kittel
8th Edition
047141526X, 978-0471415268