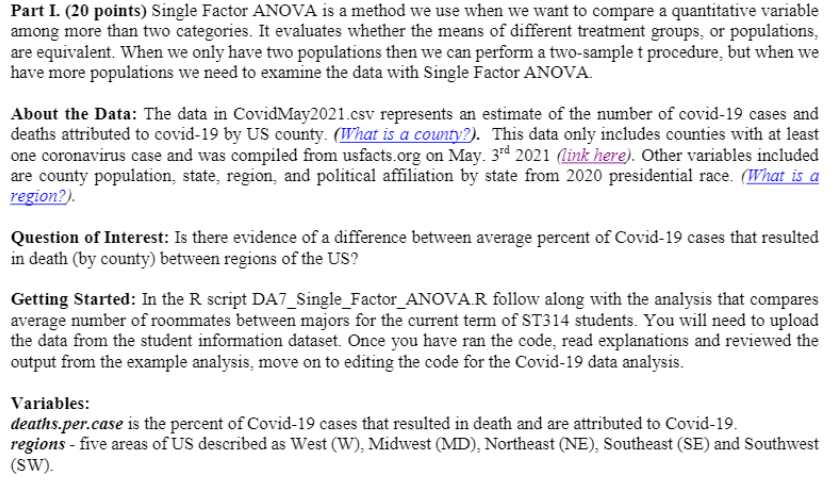
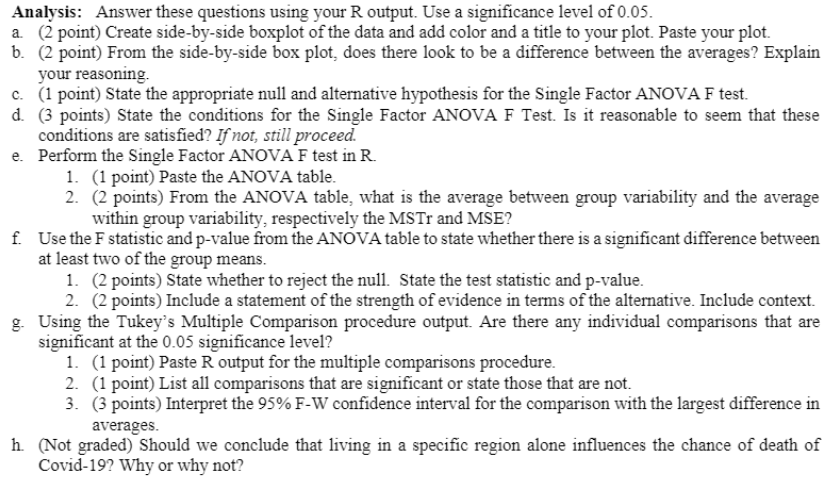
Part I. (20 points) Single Factor ANOVA is a method we use when we want to compare a quantitative variable among more than two categories. It evaluates whether the means of different treatment groups, or populations, are equivalent. When we only have two populations then we can perform a two-sample t procedure, but when we have more populations we need to examine the data with Single Factor ANOVA. About the Data: The data in CovidMay2021.csv represents an estimate of the number of covid-19 cases and deaths attributed to covid-19 by US county. (What is a county?). This data only includes counties with at least one coronavirus case and was compiled from usfacts.org on May. 3"d 2021 (link here). Other variables included are county population, state, region, and political affiliation by state from 2020 presidential race. (What is a region?). Question of Interest: Is there evidence of a difference between average percent of Covid-19 cases that resulted in death (by county) between regions of the US? Getting Started: In the R script DA7_Single_Factor_ANOVA.R follow along with the analysis that compares average number of roommates between majors for the current term of ST314 students. You will need to upload the data from the student information dataset. Once you have ran the code, read explanations and reviewed the output from the example analysis, move on to editing the code for the Covid-19 data analysis. Variables: deaths.per.case is the percent of Covid-19 cases that resulted in death and are attributed to Covid-19. regions - five areas of US described as West (W), Midwest (MD), Northeast (NE), Southeast (SE) and Southwest (SW).Analysis: Answer these questions using your R output. Use a significance level of 0.05. a. (2 point) Create side-by-side boxplot of the data and add color and a title to your plot. Paste your plot. b. (2 point) From the side-by-side box plot, does there look to be a difference between the averages? Explain your reasoning. C. (1 point) State the appropriate null and alternative hypothesis for the Single Factor ANOVA F test. d. (3 points) State the conditions for the Single Factor ANOVA F Test. Is it reasonable to seem that these conditions are satisfied? If not, still proceed. e. Perform the Single Factor ANOVA F test in R. 1. (1 point) Paste the ANOVA table. 2. (2 points) From the ANOVA table, what is the average between group variability and the average within group variability, respectively the MSTr and MSE? f. Use the F statistic and p-value from the ANOVA table to state whether there is a significant difference between at least two of the group means. 1. (2 points) State whether to reject the null. State the test statistic and p-value. 2. (2 points) Include a statement of the strength of evidence in terms of the alternative. Include context. g. Using the Tukey's Multiple Comparison procedure output. Are there any individual comparisons that are significant at the 0.05 significance level? 1. (1 point) Paste R output for the multiple comparisons procedure. 2. (1 point) List all comparisons that are significant or state those that are not. 3. (3 points) Interpret the 95% F-W confidence interval for the comparison with the largest difference in averages. h. (Not graded) Should we conclude that living in a specific region alone influences the chance of death of Covid-19? Why or why not


