Part I: Financial Statement Analysis
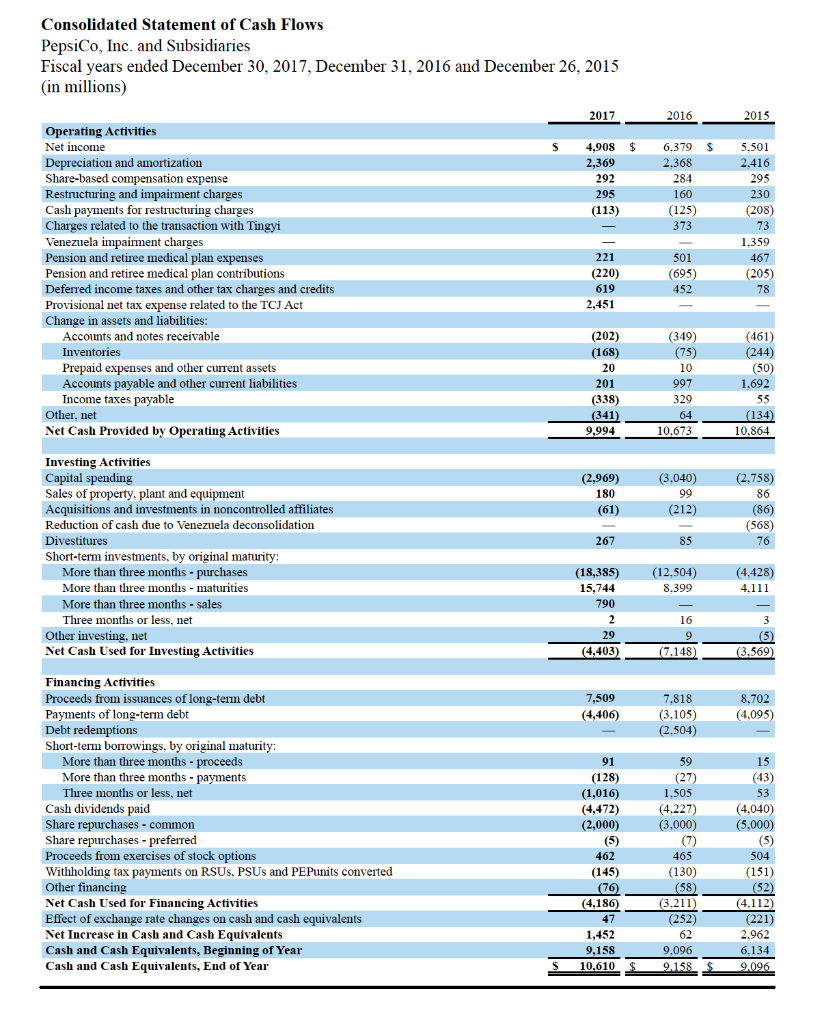
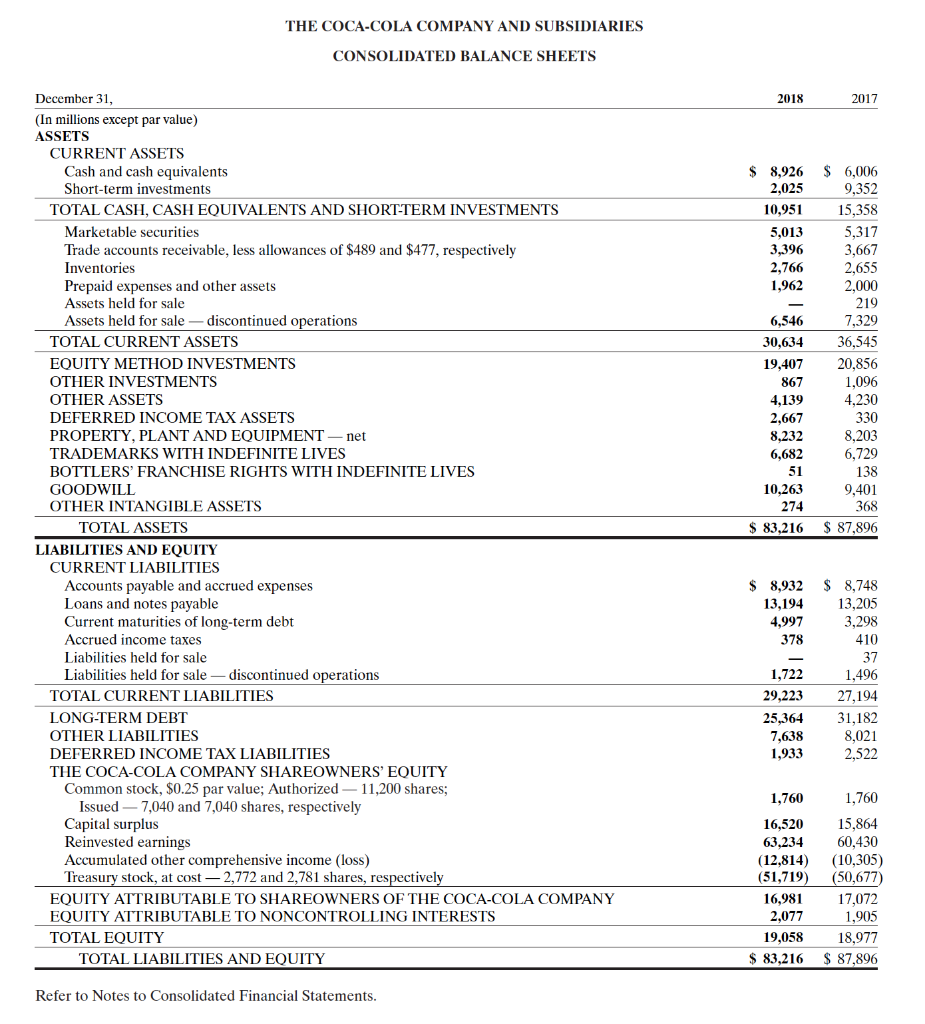
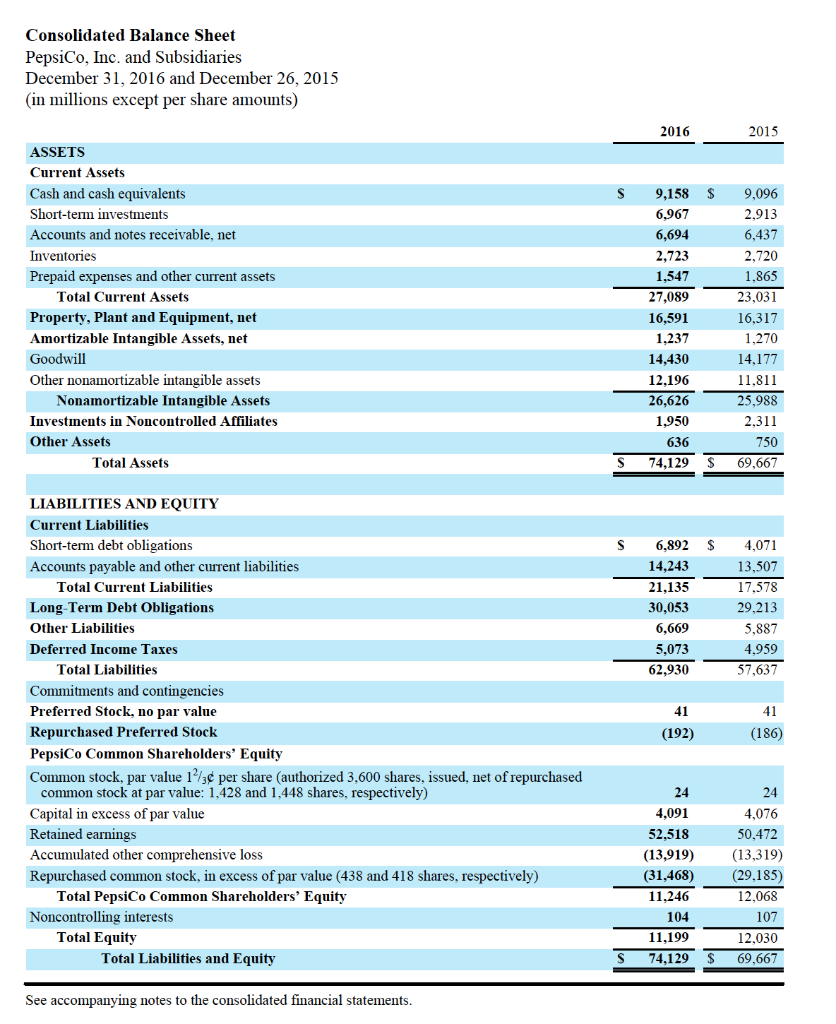
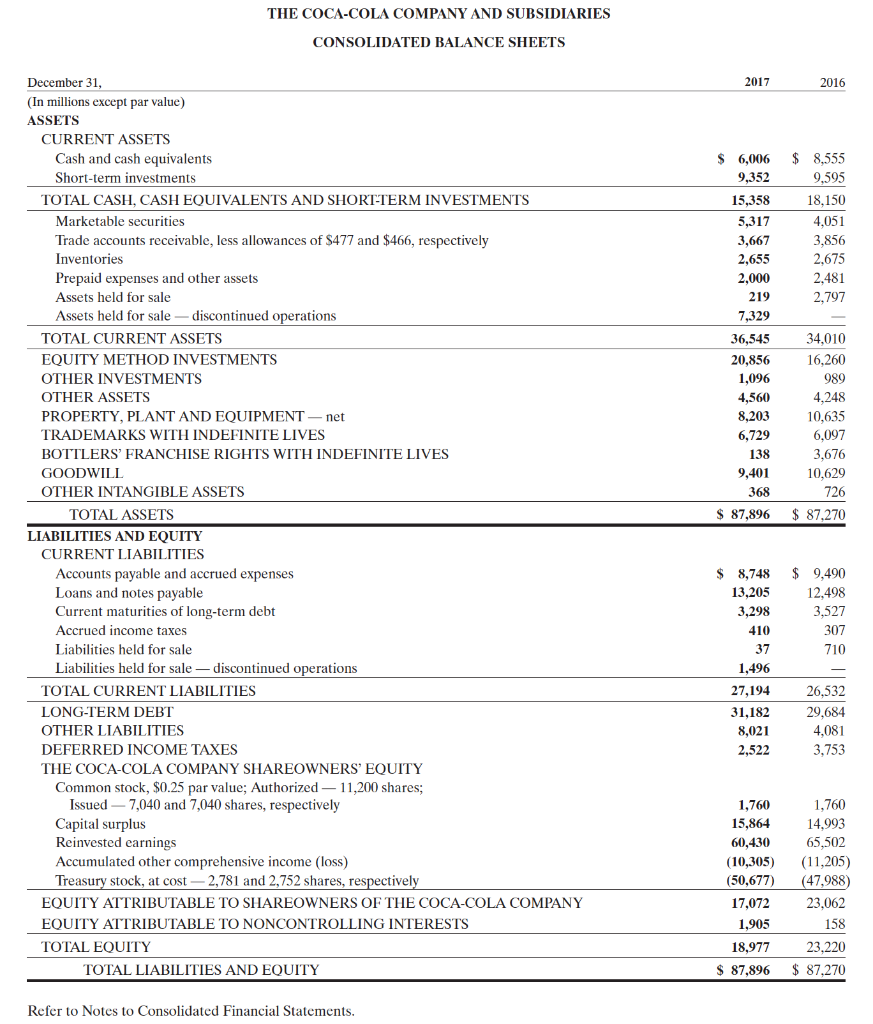
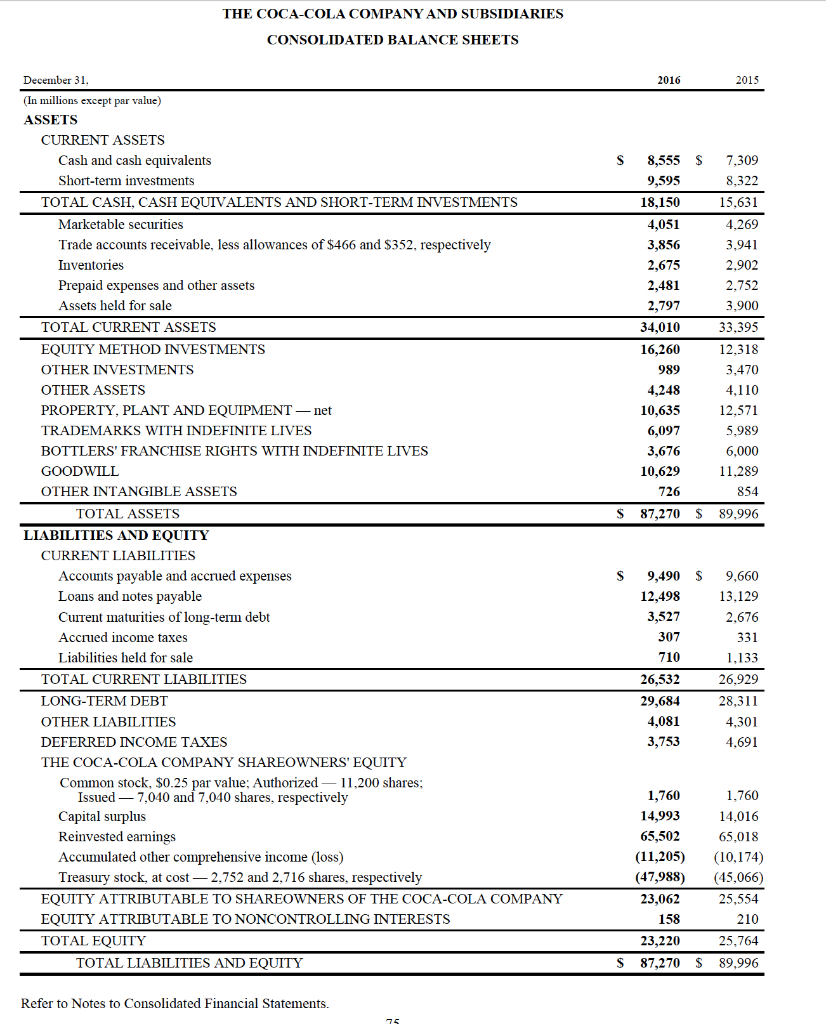
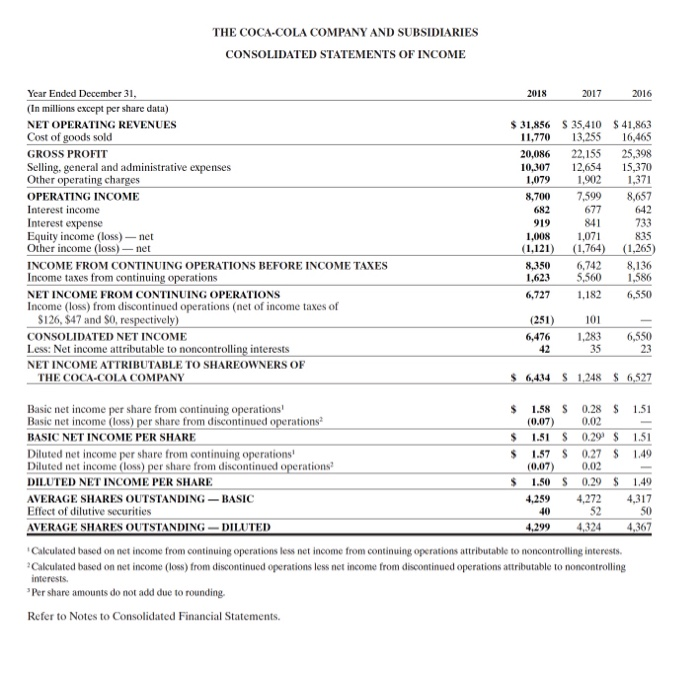
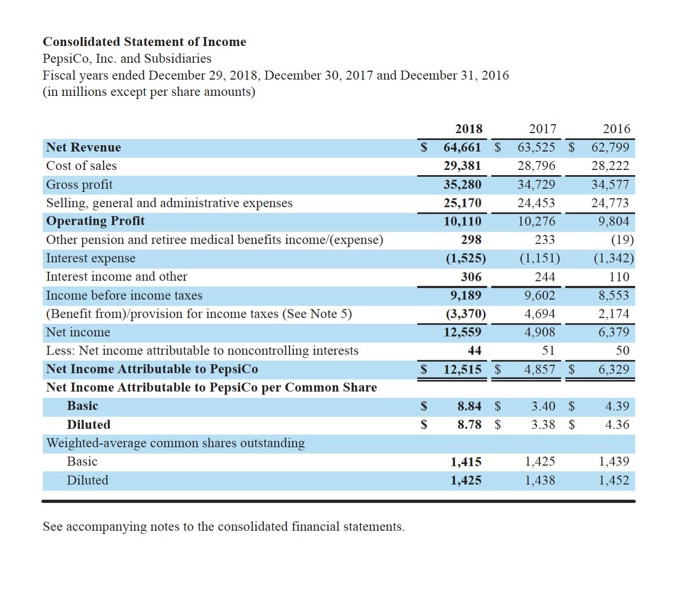
You are required to apply the tools of analysis learned in the course to analyze and assess the financial performance of The Coca-Cola Company and PepsiCo, Inc. for the years 2016 2018.
Requirement (1):
Compute and classify the following financial ratios for each company for the fiscal years 2016, 2017, and 2018 based on their respective annual reports.
Inventory turnover (efficiency)
Days sales in inventory (efficiency)
Accounts receivable turnover (efficiency)
Total asset turnover (efficiency)
Times interest earned (solvency)
Debt-to-equity ratio (solvency)
Book value per ordinary share ( market prospect)
Basic earnings per share (market prospect)
Price-earnings ratio (market prospect)
Dividend yield (Market prospects)
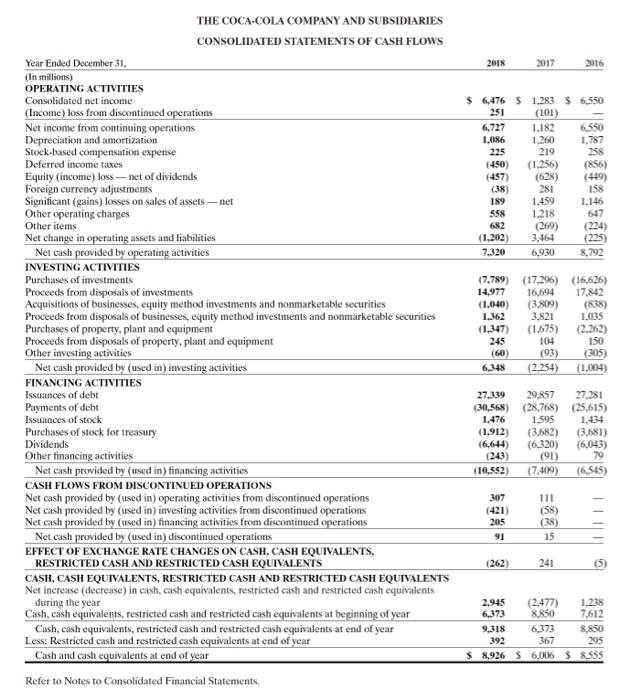
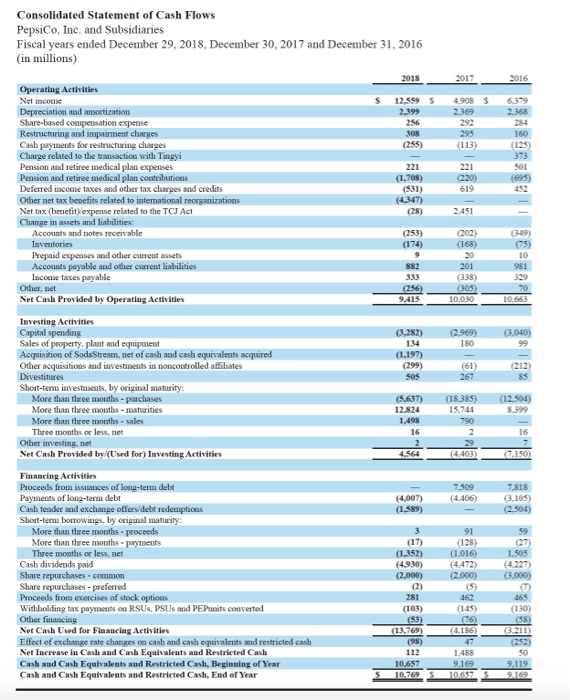
Cash flow on total assets (liquidity)
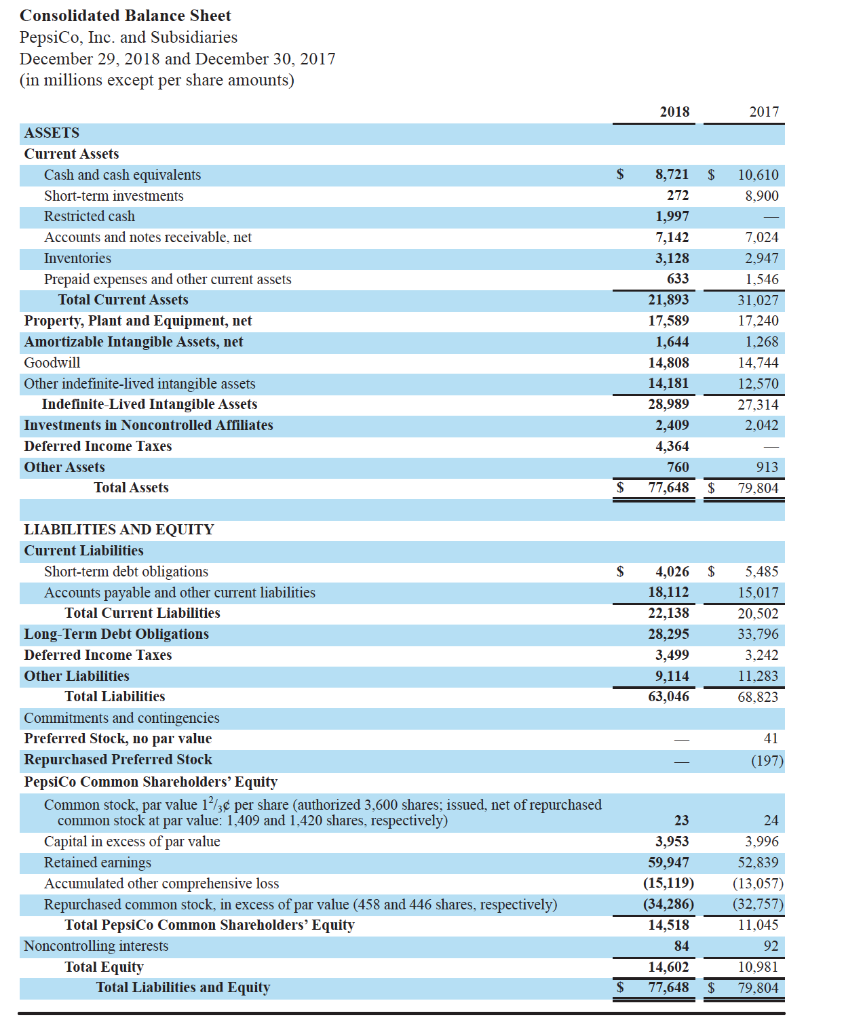
Consolidated Balance Sheet PepsiCo, Inc. and Subsidiaries December 29, 2018 and December 30, 2017 (in millions except per share amounts) 2018 2017 ASSETS Current Assets Cash and cash equivalents Short-term investments Restricted cash Accounts and notes receivable, net Inventories Prepaid expenses and other current assets Total Current Assets Property, Plant and Equipment, net Amortizable Intangible Assets, net Goodwill Other indefinite-lived intangible assets Indefinite-Lived Intangible Assets Investments in Noncontrolled Affiliates Deferred Income Taxes Other Assets Total Assets 8,721 $ 10.610 2728,900 1,997 7,142 7,024 3,128 2,947 633 1,546 21,893 31,027 17,589 17.240 1,644 1.268 14,808 14,744 14,181 12,570 28,989 2 7,314 2,409 2,042 4,364 760 913 77,648 $ 79,804 $ $ $ 4,026 18,112 22,138 28,295 3,499 9,114 63,046 5,485 15,017 20,502 33,796 3.242 11.283 68,823 3.2- LIABILITIES AND EQUITY Current Liabilities Short-term debt obligations Accounts payable and other current liabilities Total Current Liabilities Long-Term Debt Obligations Deferred Income Taxes Other Liabilities Total Liabilities Commitments and contingencies Preferred Stock, no par value Repurchased Preferred Stock PepsiCo Common Shareholders' Equity Common stock, par value 1/3 per share (authorized 3.600 shares; issued, net of repurchased common stock at par value: 1,409 and 1,420 shares, respectively) Capital in excess of par value Retained earnings Accumulated other comprehensive loss Repurchased common stock, in excess of par value (458 and 446 shares, respectively) Total PepsiCo Common Shareholders' Equity Noncontrolling interests Total Equity Total Liabilities and Equity - - 41 (197) 23 3,953 59,947 (15,119) (34,286) 14,518 84 14,602 77,648 24 3,996 52.839 (13,057) (32,757) 11.045 92 10,981 79,804 $ $ 2016 2015 $ $ Consolidated Statement of Cash Flows PepsiCo, Inc. and Subsidiaries Fiscal years ended December 30, 2017, December 31, 2016 and December 26, 2015 (in millions) 2017 Operating Activities Net income 4,908 Depreciation and amortization 2,369 Share-based compensation expense 292 Restructuring and impairment charges 295 Cash payments for restructuring charges (113) Charges related to the transaction with Tingyi Venezuela impairment charges Pension and retiree medical plan expenses 221 Pension and retiree medical plan contributions (220) Deferred income taxes and other tax charges and credits 619 Provisional net tax expense related to the TCJ Act 2,451 Change in assets and liabilities: Accounts and notes receivable (202) Inventories (168) Prepaid expenses and other current assets Accounts payable and other current liabilities Income taxes payable (338) Other, net (341) Net Cash Provided by Operating Activities 9,994 6.379 2.368 284 160 (125) 373 5.501 2.416 295 230 (208) 501 (695) 452 1.359 467 (205) 78 (349) (75) 10 (461) (244) (50) 1,692 20 201 997 55 329 64 10.673 (134) 10.864 (2,969) 180 (61) (3.040) 99 (212) (2.758) 86 (86) (568) 76 267 85 Investing Activities Capital spending Sales of property, plant and equipment Acquisitions and investments in noncontrolled affiliates Reduction of cash due to Venezuela deconsolidation Divestitures Short-term investments, by original maturity: More than three months - purchases More than three months - maturities More than three months - sales Three months or less, net Other investing. net Net Cash Used for Investing Activities (12.504) (18,385) 15,744 790 (4.428) 4.111 29 16 9 (7.148) (4.403) (3,569) 7,509 (4,406) 7.818 (3,105) (2.504) 8,702 (4,095) 59 15 (43) 53 Financing Activities Proceeds from issuances of long-term debt Payments of long-term debt Debt redemptions Short-term borrowings, by original maturity: More than three months - proceeds More than three months - payments Three months or less, net Cash dividends paid Share repurchases - common Share repurchases - preferred Proceeds from exercises of stock options Withholding tax payments on RSUS, PSUs and PEPunits converted Other financing Net Cash Used for Financing Activities Effect of exchange rate changes on cash and cash equivalents Net Increase in Cash and Cash Equivalents Cash and Cash Equivalents, Beginning of Year Cash and Cash Equivalents, End of Year (27) 1.505 (4.227) (3.000) (4,040) (5,000) (5) (1) 504 91 (128) (1,016) (4,472) (2,000) (5) 462 (145) (76) (4,186) 47 1,452 9,158 10.610 465 (130) (58) (3.211) (252) 62 9.096 9.158 (151) (52) (4.112) (221) 2,962 6.134 9.096 $ S THE COCA-COLA COMPANY AND SUBSIDIARIES CONSOLIDATED BALANCE SHEETS 2018 2017 $ $ 6,006 9,352 15,358 8,926 2,025 10,951 5,013 3,396 2,766 1,962 5,317 6,546 30,634 19,407 867 4,139 2,667 8,232 6,682 December 31, (In millions except par value) ASSETS CURRENT ASSETS Cash and cash equivalents Short-term investments TOTAL CASH, CASH EQUIVALENTS AND SHORT-TERM INVESTMENTS Marketable securities Trade accounts receivable, less allowances of $489 and $477, respectively Inventories Prepaid expenses and other assets Assets held for sale Assets held for sale - discontinued operations TOTAL CURRENT ASSETS EQUITY METHOD INVESTMENTS OTHER INVESTMENTS OTHER ASSETS DEFERRED INCOME TAX ASSETS PROPERTY, PLANT AND EQUIPMENT - net TRADEMARKS WITH INDEFINITE LIVES BOTTLERS' FRANCHISE RIGHTS WITH INDEFINITE LIVES GOODWILL OTHER INTANGIBLE ASSETS TOTAL ASSETS LIABILITIES AND EQUITY CURRENT LIABILITIES Accounts payable and accrued expenses Loans and notes payable Current maturities of long-term debt Accrued income taxes Liabilities held for sale Liabilities held for sale - discontinued operations TOTAL CURRENT LIABILITIES LONG-TERM DEBT OTHER LIABILITIES DEFERRED INCOME TAX LIABILITIES THE COCA-COLA COMPANY SHAREOWNERS' EQUITY Common stock, $0.25 par value; Authorized 11,200 shares; Issued - 7,040 and 7,040 shares, respectively Capital surplus Reinvested earnings Accumulated other comprehensive income (loss) Treasury stock, at cost - 2,772 and 2,781 shares, respectively EQUITY ATTRIBUTABLE TO SHAREOWNERS OF THE COCA-COLA COMPANY EQUITY ATTRIBUTABLE TO NONCONTROLLING INTERESTS TOTAL EQUITY TOTAL LIABILITIES AND EQUITY 3,667 2,655 2,000 219 7,329 36,545 20,856 1,096 4,230 330 8,203 6,729 138 9,401 368 $ 87,896 51 10,263 274 $ 83,216 $ $ 8,932 13,194 4,997 378 1,722 29,223 25,364 7,638 1,933 8,748 13,205 3,298 410 37 1,496 27,194 31,182 8,021 2,522 1,760 16,520 63,234 (12.814) (51,719) 16,981 2,077 19,058 $ 83,216 1,760 15,864 60,430 (10.305) (50,677) 17,072 1,905 18,977 $ 87,896 Refer to Notes to Consolidated Financial Statements. Consolidated Balance Sheet PepsiCo, Inc. and Subsidiaries December 31, 2016 and December 26, 2015 (in millions except per share amounts) 2016 2015 S $ ASSETS Current Assets Cash and cash equivalents Short-term investments Accounts and notes receivable, net Inventories Prepaid expenses and other current assets Total Current Assets Property, Plant and Equipment, net Amortizable Intangible Assets, net Goodwill Other nonamortizable intangible assets Nonamortizable Intangible Assets Investinents in Noncontrolled Affiliates Other Assets Total Assets 9,158 6,967 6,694 2,723 1,547 27,089 16,591 1,237 14,430 12,196 26,626 1,950 636 74,129 9,096 2,913 6,437 2,720 1,865 23,031 16,317 1,270 14,177 11,811 25,988 2,311 750 69,667 S $ S $ 6,892 14,243 21,135 30,053 6,669 5,073 62,930 4,071 13,507 17,578 29,213 5,887 4,959 57,637 LIABILITIES AND EQUITY Current Liabilities Short-term debt obligations Accounts payable and other current liabilities Total Current Liabilities Long-Term Debt Obligations Other Liabilities Deferred Income Taxes Total Liabilities Commitments and contingencies Preferred Stock, no par value Repurchased Preferred Stock PepsiCo Common Shareholders' Equity Common stock, par value 1/3 per share authorized 3.600 shares, issued, net of repurchased common stock at par value: 1,428 and 1,448 shares, respectively) Capital in excess of par value Retained earnings Accumulated other comprehensive loss Repurchased common stock, in excess of par value (438 and 418 shares, respectively) Total PepsiCo Common Shareholders' Equity Noncontrolling interests Total Equity Total Liabilities and Equity 4141 (192) (186) 4,091 52,518 (13,919) (31,468) 11,246 104 11,199 74,129 24 4,076 50,472 (13,319) (29,185) 12,068 107 12.030 69,667 S $ See accompanying notes to the consolidated financial statements. THE COCA-COLA COMPANY AND SUBSIDIARIES CONSOLIDATED BALANCE SHEETS 2017 2016 5,317 $ 6,006 $ 8,555 9,3529,595 15,358 18,150 4,051 3,667 3,856 2,655 2,675 2,000 2,481 219 2,797 7,329 36,545 34.010 20,856 16,260 1,096 989 4,560 4,248 8,203 10,635 6,729 6,097 138 3,676 9,401 10,629 726 $ 87,896 $ 87,270 368 December 31, (In millions except par value) ASSETS CURRENT ASSETS Cash and cash equivalents Short-term investments TOTAL CASH, CASH EQUIVALENTS AND SHORT-TERM INVESTMENTS Marketable securities Trade accounts receivable, less allowances of $477 and $466, respectively Inventories Prepaid expenses and other assets Assets held for sale Assets held for sale - discontinued operations TOTAL CURRENT ASSETS EQUITY METHOD INVESTMENTS OTHER INVESTMENTS OTHER ASSETS PROPERTY, PLANT AND EQUIPMENT - net TRADEMARKS WITH INDEFINITE LIVES BOTTLERS' FRANCHISE RIGHTS WITH INDEFINITE LIVES GOODWILL OTHER INTANGIBLE ASSETS TOTAL ASSETS LIABILITIES AND EQUITY CURRENT LIABILITIES Accounts payable and accrued expenses Loans and notes payable Current maturities of long-term debt Accrued income taxes Liabilities held for sale Liabilities held for sale discontinued operations TOTAL CURRENT LIABILITIES LONG-TERM DEBT OTHER LIABILITIES DEFERRED INCOME TAXES THE COCA-COLA COMPANY SHAREOWNERS' EQUITY Common stock, $0.25 par value; Authorized - 11,200 shares; Issued - 7,040 and 7,040 shares, respectively Capital surplus Reinvested earnings Accumulated other comprehensive income (loss) Treasury stock, at cost 2,781 and 2,752 shares, respectively EQUITY ATTRIBUTABLE TO SHAREOWNERS OF THE COCA-COLA COMPANY EQUITY ATTRIBUTABLE TO NONCONTROLLING INTERESTS TOTAL EQUITY TOTAL LIABILITIES AND EQUITY $ $ 8,748 13,205 3,298 410 9,490 12,498 3,527 307 37 710 1,496 27,194 31,182 8,021 2,522 26,532 29,684 4,081 3,753 1,760 1,760 15,864 14,993 60,430 65,502 (10,305) (11,205) (50,677) (47,988) 17,07223,062 1,905 158 18,977 23,220 $ 87,896 $ 87,270 Refer to Notes to Consolidated Financial Statements. THE COCA-COLA COMPANY AND SUBSIDIARIES CONSOLIDATED BALANCE SHEETS 2016 2015 S $ 8,555 9,595 18,150 4,051 3,856 2,675 2,481 2,797 34,010 16,260 989 4,248 10,635 6,097 3,676 10,629 726 87,270 7,309 8,322 15.631 4,269 3,941 2,902 2,752 3,900 33,395 12,318 3,470 4,110 12,571 5,989 6,000 11,289 854 89,996 $ $ December 31. (In millions except par value) ASSETS CURRENT ASSETS Cash and cash equivalents Short-term investments TOTAL CASH, CASH EQUIVALENTS AND SHORT-TERM INVESTMENTS Marketable securities Trade accounts receivable, less allowances of $466 and $352, respectively Inventories Prepaid expenses and other assets Assets held for sale TOTAL CURRENT ASSETS EQUITY METHOD INVESTMENTS OTHER INVESTMENTS OTHER ASSETS PROPERTY, PLANT AND EQUIPMENT net TRADEMARKS WITH INDEFINITE LIVES BOTTLERS' FRANCHISE RIGHTS WITH INDEFINITE LIVES GOODWILL OTHER INTANGIBLE ASSETS TOTAL ASSETS LIABILITIES AND EQUITY CURRENT LIABILITIES Accounts payable and accrued expenses Loans and notes payable Current maturities of long-term debt Accrued income taxes Liabilities held for sale TOTAL CURRENT LIABILITIES LONG-TERM DEBT OTHER LIABILITIES DEFERRED INCOME TAXES THE COCA-COLA COMPANY SHAREOWNERS' EQUITY Common stock, $0.25 par value; Authorized - 11.200 shares: Issued 7,040 and 7,040 shares, respectively Capital surplus Reinvested earnings Accumulated other comprehensive income (loss) Treasury stock, at cost - 2,752 and 2,716 shares, respectively EQUITY ATTRIBUTABLE TO SHAREOWNERS OF THE COCA-COLA COMPANY EQUITY ATTRIBUTABLE TO NONCONTROLLING INTERESTS TOTAL EQUITY TOTAL LIABILITIES AND EQUITY $ $ 9,490 12,498 3,527 307 710 26,532 29,684 4,081 3,753 9,660 13,129 2,676 331 1,133 26,929 28,311 4,301 4,691 1,760 14,993 65,502 (11,205) (47,988) 23,062 158 23,220 87,270 1,760 14,016 65,018 (10,174) (45,066) 25,554 210 25,764 89,996 $ $ Refer to Notes to Consolidated Financial Statements. THE COCA-COLA COMPANY AND SUBSIDIARIES CONSOLIDATED STATEMENTS OF INCOME 2018 2017 2016 $ 31,856 11,770 20,086 10,307 1,079 8,700 682 919 1,008 (1.121) 8.350 1,623 6,727 Year Ended December 31, (In millions except per share data) NET OPERATING REVENUES Cost of goods sold GROSS PROFIT Selling, general and administrative expenses Other operating charges OPERATING INCOME Interest income Interest expense Equity income (loss) - net Other income (loss) - net INCOME FROM CONTINUING OPERATIONS BEFORE INCOME TAXES Income taxes from continuing operations NET INCOME FROM CONTINUING OPERATIONS Income (loss) from discontinued operations (net of income taxes of $126, $47 and SO, respectively) CONSOLIDATED NET INCOME Less: Net income attributable to noncontrolling interests NET INCOME ATTRIBUTABLE TO SHAREOWNERS OF THE COCA-COLA COMPANY S 35,410 13,255 22,155 12,654 1,902 7,599 677 841 1,071 (1,764) 6,742 5.560 1.182 $ 41,863 16,465 25,398 15,370 1,371 8,657 642 733 8 35 (1,265) 8.136 1.586 6,550 (251) 6,476 42 101 1,283 35 6,550 23 $ 6,434 S 1,248 $ 6,527 $ $ $ Basic net income per share from continuing operations! Basic net income (loss) per share from discontinued operations BASIC NET INCOME PER SHARE Diluted net income per share from continuing operations! Diluted net income (loss) per share from discontinued operations DILUTED NET INCOME PER SHARE AVERAGE SHARES OUTSTANDING - BASIC Effect of dilutive securities AVERAGE SHARES OUTSTANDING DILUTED 1.58 S (0.07) 1.51 $ 1.57 $ (0.07) 1.50 S 4,259 4,299 0.28 $ 1.51 0.02 0.29 $ 1.51 0.27 $ 1.49 0.02 0.29 $ 1.49 4.2724,347 4,324 4,367 $ $ 2 50 Calculated based on net income from continuing operations less net income from continuing operations attributable to noncontrolling interests. Calculated based on net income (loss) from discontinued operations less net income from discontinued operations attributable to noncontrolling interests. Per share amounts do not add due to rounding Refer to Notes to Consolidated Financial Statements. Consolidated Statement of Income PepsiCo, Inc. and Subsidiaries Fiscal years ended December 29, 2018, December 30, 2017 and December 31, 2016 (in millions except per share amounts) Net Revenue Cost of sales Gross profit Selling, general and administrative expenses Operating Profit Other pension and retiree medical benefits income/expense) Interest expense Interest income and other Income before income taxes (Benefit from) provision for income taxes (See Note 5) Net income Less: Net income attributable to noncontrolling interests Net Income Attributable to PepsiCo Net Income Attributable to PepsiCo per Common Share Basic Diluted Weighted average common shares outstanding Basic Diluted 2018 2017 2016 S 64,661 $ 63,525 $ 62,799 29,381 28,796 28,222 35,280 34,729 3 4,577 25,170 24,453 24,773 10,110 10,276 9,804 298 233 (19) (1,525) (1,151) (1,342) 306 244 110 9,189 9,602 8,553 (3,370) 4,694 2,174 12,559 4,908 6.379 51 $ 12,515 $ 4,857 $ 6,329 S S 8.84 8.78 $ $ 3.40 3.38 $ $ 4.39 4.36 1,415 1,425 1,425 1,438 1,439 1,452 See accompanying notes to the consolidated financial statements. Consolidated Statement of Cash Flows PepsiCo, Inc. and Subsidiaries Fiscal years ended December 29, 2018, December 30, 2017 and December 31, 2016 (in millions) 2018 2017 2016 6.379 21 12 5595 2399 256 SOS (255) 4908 5 2369 292 295 (113) 10 125 373 (220) Operating Activities Nt HuHI Depreciation and amortization Share-based compensation expense Restructuring and impairment charges Cash payments for restructuring charges Charge related to the transaction with Tingyi Pension and retiree medical plan expenses Pension and retiree medical plan contributions Deferred income taxes and other tax charges and credits Othernet tax benefits related to international reorganizations Net tax (benefit expense related to the TCJ Act Change in assets and liabilities: Accounts and notes receivable Inventores Prepaid expenses and other current assets Accounts payable and other current liabilities Income tauces payable Othernet Net Cash Provided by Operating Activities 221 (1,708) (531) (4.347) 619 (28) 2451 (253) (174) (200 (168) 201 338) (305) 10.030 9415 (3.282) (2.969) 180 (3.040) 134 (1.197) (299) sos (61) (2120 267 Investing Activities Capital spending Sales of property, plant and equipment Acquisition of SodaStream, net of cash and cash equivalents acquired Other acquisitions and investments in non controlled affiliates Divestitures Short-term investment, by original maturity: More than three months - purchases More than three months - maturities More than three months sales Three months or less, net Other investing.net Net Cash Provided by (Used for) Investing Activities (12500 (S4637) 12824 1.498 (18385) 15.741 790 29 4,564 (6.403) 150 1818 1509 (4.406) 105 (4,007) (1.589) C2504) 9 Financing Activities Proceeds from issuances of long-len det Payments of long-term deb Cash tender and exchange ollers debt redemptions Short-term borrowes, by onenal maturity: More than three months - proceeds More than three months - payments Three months or less.net Cash dividends paid Share repurchases common Share repurchaus preferred Proceeds from exercises of stock options Withholding tax payments on RSUS, PSUs and PE Punits converted Other financing Net Cash Used for Financing Activities Effect of exchange rate changes on cash and cash equivalents and restricted cash Net Increase in Cash and Cash Equivalents and Restricted Casla Cash and Cash Equivalents and Restricted Cash, Beginning of Year Cash and Cash Equivalents and Restricted Cash, End of Year (17) (1.352) (4.930) (2.000) (128) (1.016) (4472) (2.000) 27 1.505 (4.227) (2.000) 5 281 164 (130) (103) (53) 462 (105) (76) (4.186) (13,769) 10.657 10.769 5 10697 Consolidated Balance Sheet PepsiCo, Inc. and Subsidiaries December 29, 2018 and December 30, 2017 (in millions except per share amounts) 2018 2017 ASSETS Current Assets Cash and cash equivalents Short-term investments Restricted cash Accounts and notes receivable, net Inventories Prepaid expenses and other current assets Total Current Assets Property, Plant and Equipment, net Amortizable Intangible Assets, net Goodwill Other indefinite-lived intangible assets Indefinite-Lived Intangible Assets Investments in Noncontrolled Affiliates Deferred Income Taxes Other Assets Total Assets 8,721 $ 10.610 2728,900 1,997 7,142 7,024 3,128 2,947 633 1,546 21,893 31,027 17,589 17.240 1,644 1.268 14,808 14,744 14,181 12,570 28,989 2 7,314 2,409 2,042 4,364 760 913 77,648 $ 79,804 $ $ $ 4,026 18,112 22,138 28,295 3,499 9,114 63,046 5,485 15,017 20,502 33,796 3.242 11.283 68,823 3.2- LIABILITIES AND EQUITY Current Liabilities Short-term debt obligations Accounts payable and other current liabilities Total Current Liabilities Long-Term Debt Obligations Deferred Income Taxes Other Liabilities Total Liabilities Commitments and contingencies Preferred Stock, no par value Repurchased Preferred Stock PepsiCo Common Shareholders' Equity Common stock, par value 1/3 per share (authorized 3.600 shares; issued, net of repurchased common stock at par value: 1,409 and 1,420 shares, respectively) Capital in excess of par value Retained earnings Accumulated other comprehensive loss Repurchased common stock, in excess of par value (458 and 446 shares, respectively) Total PepsiCo Common Shareholders' Equity Noncontrolling interests Total Equity Total Liabilities and Equity - - 41 (197) 23 3,953 59,947 (15,119) (34,286) 14,518 84 14,602 77,648 24 3,996 52.839 (13,057) (32,757) 11.045 92 10,981 79,804 $ $ 2016 2015 $ $ Consolidated Statement of Cash Flows PepsiCo, Inc. and Subsidiaries Fiscal years ended December 30, 2017, December 31, 2016 and December 26, 2015 (in millions) 2017 Operating Activities Net income 4,908 Depreciation and amortization 2,369 Share-based compensation expense 292 Restructuring and impairment charges 295 Cash payments for restructuring charges (113) Charges related to the transaction with Tingyi Venezuela impairment charges Pension and retiree medical plan expenses 221 Pension and retiree medical plan contributions (220) Deferred income taxes and other tax charges and credits 619 Provisional net tax expense related to the TCJ Act 2,451 Change in assets and liabilities: Accounts and notes receivable (202) Inventories (168) Prepaid expenses and other current assets Accounts payable and other current liabilities Income taxes payable (338) Other, net (341) Net Cash Provided by Operating Activities 9,994 6.379 2.368 284 160 (125) 373 5.501 2.416 295 230 (208) 501 (695) 452 1.359 467 (205) 78 (349) (75) 10 (461) (244) (50) 1,692 20 201 997 55 329 64 10.673 (134) 10.864 (2,969) 180 (61) (3.040) 99 (212) (2.758) 86 (86) (568) 76 267 85 Investing Activities Capital spending Sales of property, plant and equipment Acquisitions and investments in noncontrolled affiliates Reduction of cash due to Venezuela deconsolidation Divestitures Short-term investments, by original maturity: More than three months - purchases More than three months - maturities More than three months - sales Three months or less, net Other investing. net Net Cash Used for Investing Activities (12.504) (18,385) 15,744 790 (4.428) 4.111 29 16 9 (7.148) (4.403) (3,569) 7,509 (4,406) 7.818 (3,105) (2.504) 8,702 (4,095) 59 15 (43) 53 Financing Activities Proceeds from issuances of long-term debt Payments of long-term debt Debt redemptions Short-term borrowings, by original maturity: More than three months - proceeds More than three months - payments Three months or less, net Cash dividends paid Share repurchases - common Share repurchases - preferred Proceeds from exercises of stock options Withholding tax payments on RSUS, PSUs and PEPunits converted Other financing Net Cash Used for Financing Activities Effect of exchange rate changes on cash and cash equivalents Net Increase in Cash and Cash Equivalents Cash and Cash Equivalents, Beginning of Year Cash and Cash Equivalents, End of Year (27) 1.505 (4.227) (3.000) (4,040) (5,000) (5) (1) 504 91 (128) (1,016) (4,472) (2,000) (5) 462 (145) (76) (4,186) 47 1,452 9,158 10.610 465 (130) (58) (3.211) (252) 62 9.096 9.158 (151) (52) (4.112) (221) 2,962 6.134 9.096 $ S THE COCA-COLA COMPANY AND SUBSIDIARIES CONSOLIDATED BALANCE SHEETS 2018 2017 $ $ 6,006 9,352 15,358 8,926 2,025 10,951 5,013 3,396 2,766 1,962 5,317 6,546 30,634 19,407 867 4,139 2,667 8,232 6,682 December 31, (In millions except par value) ASSETS CURRENT ASSETS Cash and cash equivalents Short-term investments TOTAL CASH, CASH EQUIVALENTS AND SHORT-TERM INVESTMENTS Marketable securities Trade accounts receivable, less allowances of $489 and $477, respectively Inventories Prepaid expenses and other assets Assets held for sale Assets held for sale - discontinued operations TOTAL CURRENT ASSETS EQUITY METHOD INVESTMENTS OTHER INVESTMENTS OTHER ASSETS DEFERRED INCOME TAX ASSETS PROPERTY, PLANT AND EQUIPMENT - net TRADEMARKS WITH INDEFINITE LIVES BOTTLERS' FRANCHISE RIGHTS WITH INDEFINITE LIVES GOODWILL OTHER INTANGIBLE ASSETS TOTAL ASSETS LIABILITIES AND EQUITY CURRENT LIABILITIES Accounts payable and accrued expenses Loans and notes payable Current maturities of long-term debt Accrued income taxes Liabilities held for sale Liabilities held for sale - discontinued operations TOTAL CURRENT LIABILITIES LONG-TERM DEBT OTHER LIABILITIES DEFERRED INCOME TAX LIABILITIES THE COCA-COLA COMPANY SHAREOWNERS' EQUITY Common stock, $0.25 par value; Authorized 11,200 shares; Issued - 7,040 and 7,040 shares, respectively Capital surplus Reinvested earnings Accumulated other comprehensive income (loss) Treasury stock, at cost - 2,772 and 2,781 shares, respectively EQUITY ATTRIBUTABLE TO SHAREOWNERS OF THE COCA-COLA COMPANY EQUITY ATTRIBUTABLE TO NONCONTROLLING INTERESTS TOTAL EQUITY TOTAL LIABILITIES AND EQUITY 3,667 2,655 2,000 219 7,329 36,545 20,856 1,096 4,230 330 8,203 6,729 138 9,401 368 $ 87,896 51 10,263 274 $ 83,216 $ $ 8,932 13,194 4,997 378 1,722 29,223 25,364 7,638 1,933 8,748 13,205 3,298 410 37 1,496 27,194 31,182 8,021 2,522 1,760 16,520 63,234 (12.814) (51,719) 16,981 2,077 19,058 $ 83,216 1,760 15,864 60,430 (10.305) (50,677) 17,072 1,905 18,977 $ 87,896 Refer to Notes to Consolidated Financial Statements. Consolidated Balance Sheet PepsiCo, Inc. and Subsidiaries December 31, 2016 and December 26, 2015 (in millions except per share amounts) 2016 2015 S $ ASSETS Current Assets Cash and cash equivalents Short-term investments Accounts and notes receivable, net Inventories Prepaid expenses and other current assets Total Current Assets Property, Plant and Equipment, net Amortizable Intangible Assets, net Goodwill Other nonamortizable intangible assets Nonamortizable Intangible Assets Investinents in Noncontrolled Affiliates Other Assets Total Assets 9,158 6,967 6,694 2,723 1,547 27,089 16,591 1,237 14,430 12,196 26,626 1,950 636 74,129 9,096 2,913 6,437 2,720 1,865 23,031 16,317 1,270 14,177 11,811 25,988 2,311 750 69,667 S $ S $ 6,892 14,243 21,135 30,053 6,669 5,073 62,930 4,071 13,507 17,578 29,213 5,887 4,959 57,637 LIABILITIES AND EQUITY Current Liabilities Short-term debt obligations Accounts payable and other current liabilities Total Current Liabilities Long-Term Debt Obligations Other Liabilities Deferred Income Taxes Total Liabilities Commitments and contingencies Preferred Stock, no par value Repurchased Preferred Stock PepsiCo Common Shareholders' Equity Common stock, par value 1/3 per share authorized 3.600 shares, issued, net of repurchased common stock at par value: 1,428 and 1,448 shares, respectively) Capital in excess of par value Retained earnings Accumulated other comprehensive loss Repurchased common stock, in excess of par value (438 and 418 shares, respectively) Total PepsiCo Common Shareholders' Equity Noncontrolling interests Total Equity Total Liabilities and Equity 4141 (192) (186) 4,091 52,518 (13,919) (31,468) 11,246 104 11,199 74,129 24 4,076 50,472 (13,319) (29,185) 12,068 107 12.030 69,667 S $ See accompanying notes to the consolidated financial statements. THE COCA-COLA COMPANY AND SUBSIDIARIES CONSOLIDATED BALANCE SHEETS 2017 2016 5,317 $ 6,006 $ 8,555 9,3529,595 15,358 18,150 4,051 3,667 3,856 2,655 2,675 2,000 2,481 219 2,797 7,329 36,545 34.010 20,856 16,260 1,096 989 4,560 4,248 8,203 10,635 6,729 6,097 138 3,676 9,401 10,629 726 $ 87,896 $ 87,270 368 December 31, (In millions except par value) ASSETS CURRENT ASSETS Cash and cash equivalents Short-term investments TOTAL CASH, CASH EQUIVALENTS AND SHORT-TERM INVESTMENTS Marketable securities Trade accounts receivable, less allowances of $477 and $466, respectively Inventories Prepaid expenses and other assets Assets held for sale Assets held for sale - discontinued operations TOTAL CURRENT ASSETS EQUITY METHOD INVESTMENTS OTHER INVESTMENTS OTHER ASSETS PROPERTY, PLANT AND EQUIPMENT - net TRADEMARKS WITH INDEFINITE LIVES BOTTLERS' FRANCHISE RIGHTS WITH INDEFINITE LIVES GOODWILL OTHER INTANGIBLE ASSETS TOTAL ASSETS LIABILITIES AND EQUITY CURRENT LIABILITIES Accounts payable and accrued expenses Loans and notes payable Current maturities of long-term debt Accrued income taxes Liabilities held for sale Liabilities held for sale discontinued operations TOTAL CURRENT LIABILITIES LONG-TERM DEBT OTHER LIABILITIES DEFERRED INCOME TAXES THE COCA-COLA COMPANY SHAREOWNERS' EQUITY Common stock, $0.25 par value; Authorized - 11,200 shares; Issued - 7,040 and 7,040 shares, respectively Capital surplus Reinvested earnings Accumulated other comprehensive income (loss) Treasury stock, at cost 2,781 and 2,752 shares, respectively EQUITY ATTRIBUTABLE TO SHAREOWNERS OF THE COCA-COLA COMPANY EQUITY ATTRIBUTABLE TO NONCONTROLLING INTERESTS TOTAL EQUITY TOTAL LIABILITIES AND EQUITY $ $ 8,748 13,205 3,298 410 9,490 12,498 3,527 307 37 710 1,496 27,194 31,182 8,021 2,522 26,532 29,684 4,081 3,753 1,760 1,760 15,864 14,993 60,430 65,502 (10,305) (11,205) (50,677) (47,988) 17,07223,062 1,905 158 18,977 23,220 $ 87,896 $ 87,270 Refer to Notes to Consolidated Financial Statements. THE COCA-COLA COMPANY AND SUBSIDIARIES CONSOLIDATED BALANCE SHEETS 2016 2015 S $ 8,555 9,595 18,150 4,051 3,856 2,675 2,481 2,797 34,010 16,260 989 4,248 10,635 6,097 3,676 10,629 726 87,270 7,309 8,322 15.631 4,269 3,941 2,902 2,752 3,900 33,395 12,318 3,470 4,110 12,571 5,989 6,000 11,289 854 89,996 $ $ December 31. (In millions except par value) ASSETS CURRENT ASSETS Cash and cash equivalents Short-term investments TOTAL CASH, CASH EQUIVALENTS AND SHORT-TERM INVESTMENTS Marketable securities Trade accounts receivable, less allowances of $466 and $352, respectively Inventories Prepaid expenses and other assets Assets held for sale TOTAL CURRENT ASSETS EQUITY METHOD INVESTMENTS OTHER INVESTMENTS OTHER ASSETS PROPERTY, PLANT AND EQUIPMENT net TRADEMARKS WITH INDEFINITE LIVES BOTTLERS' FRANCHISE RIGHTS WITH INDEFINITE LIVES GOODWILL OTHER INTANGIBLE ASSETS TOTAL ASSETS LIABILITIES AND EQUITY CURRENT LIABILITIES Accounts payable and accrued expenses Loans and notes payable Current maturities of long-term debt Accrued income taxes Liabilities held for sale TOTAL CURRENT LIABILITIES LONG-TERM DEBT OTHER LIABILITIES DEFERRED INCOME TAXES THE COCA-COLA COMPANY SHAREOWNERS' EQUITY Common stock, $0.25 par value; Authorized - 11.200 shares: Issued 7,040 and 7,040 shares, respectively Capital surplus Reinvested earnings Accumulated other comprehensive income (loss) Treasury stock, at cost - 2,752 and 2,716 shares, respectively EQUITY ATTRIBUTABLE TO SHAREOWNERS OF THE COCA-COLA COMPANY EQUITY ATTRIBUTABLE TO NONCONTROLLING INTERESTS TOTAL EQUITY TOTAL LIABILITIES AND EQUITY $ $ 9,490 12,498 3,527 307 710 26,532 29,684 4,081 3,753 9,660 13,129 2,676 331 1,133 26,929 28,311 4,301 4,691 1,760 14,993 65,502 (11,205) (47,988) 23,062 158 23,220 87,270 1,760 14,016 65,018 (10,174) (45,066) 25,554 210 25,764 89,996 $ $ Refer to Notes to Consolidated Financial Statements. THE COCA-COLA COMPANY AND SUBSIDIARIES CONSOLIDATED STATEMENTS OF INCOME 2018 2017 2016 $ 31,856 11,770 20,086 10,307 1,079 8,700 682 919 1,008 (1.121) 8.350 1,623 6,727 Year Ended December 31, (In millions except per share data) NET OPERATING REVENUES Cost of goods sold GROSS PROFIT Selling, general and administrative expenses Other operating charges OPERATING INCOME Interest income Interest expense Equity income (loss) - net Other income (loss) - net INCOME FROM CONTINUING OPERATIONS BEFORE INCOME TAXES Income taxes from continuing operations NET INCOME FROM CONTINUING OPERATIONS Income (loss) from discontinued operations (net of income taxes of $126, $47 and SO, respectively) CONSOLIDATED NET INCOME Less: Net income attributable to noncontrolling interests NET INCOME ATTRIBUTABLE TO SHAREOWNERS OF THE COCA-COLA COMPANY S 35,410 13,255 22,155 12,654 1,902 7,599 677 841 1,071 (1,764) 6,742 5.560 1.182 $ 41,863 16,465 25,398 15,370 1,371 8,657 642 733 8 35 (1,265) 8.136 1.586 6,550 (251) 6,476 42 101 1,283 35 6,550 23 $ 6,434 S 1,248 $ 6,527 $ $ $ Basic net income per share from continuing operations! Basic net income (loss) per share from discontinued operations BASIC NET INCOME PER SHARE Diluted net income per share from continuing operations! Diluted net income (loss) per share from discontinued operations DILUTED NET INCOME PER SHARE AVERAGE SHARES OUTSTANDING - BASIC Effect of dilutive securities AVERAGE SHARES OUTSTANDING DILUTED 1.58 S (0.07) 1.51 $ 1.57 $ (0.07) 1.50 S 4,259 4,299 0.28 $ 1.51 0.02 0.29 $ 1.51 0.27 $ 1.49 0.02 0.29 $ 1.49 4.2724,347 4,324 4,367 $ $ 2 50 Calculated based on net income from continuing operations less net income from continuing operations attributable to noncontrolling interests. Calculated based on net income (loss) from discontinued operations less net income from discontinued operations attributable to noncontrolling interests. Per share amounts do not add due to rounding Refer to Notes to Consolidated Financial Statements. Consolidated Statement of Income PepsiCo, Inc. and Subsidiaries Fiscal years ended December 29, 2018, December 30, 2017 and December 31, 2016 (in millions except per share amounts) Net Revenue Cost of sales Gross profit Selling, general and administrative expenses Operating Profit Other pension and retiree medical benefits income/expense) Interest expense Interest income and other Income before income taxes (Benefit from) provision for income taxes (See Note 5) Net income Less: Net income attributable to noncontrolling interests Net Income Attributable to PepsiCo Net Income Attributable to PepsiCo per Common Share Basic Diluted Weighted average common shares outstanding Basic Diluted 2018 2017 2016 S 64,661 $ 63,525 $ 62,799 29,381 28,796 28,222 35,280 34,729 3 4,577 25,170 24,453 24,773 10,110 10,276 9,804 298 233 (19) (1,525) (1,151) (1,342) 306 244 110 9,189 9,602 8,553 (3,370) 4,694 2,174 12,559 4,908 6.379 51 $ 12,515 $ 4,857 $ 6,329 S S 8.84 8.78 $ $ 3.40 3.38 $ $ 4.39 4.36 1,415 1,425 1,425 1,438 1,439 1,452 See accompanying notes to the consolidated financial statements. Consolidated Statement of Cash Flows PepsiCo, Inc. and Subsidiaries Fiscal years ended December 29, 2018, December 30, 2017 and December 31, 2016 (in millions) 2018 2017 2016 6.379 21 12 5595 2399 256 SOS (255) 4908 5 2369 292 295 (113) 10 125 373 (220) Operating Activities Nt HuHI Depreciation and amortization Share-based compensation expense Restructuring and impairment charges Cash payments for restructuring charges Charge related to the transaction with Tingyi Pension and retiree medical plan expenses Pension and retiree medical plan contributions Deferred income taxes and other tax charges and credits Othernet tax benefits related to international reorganizations Net tax (benefit expense related to the TCJ Act Change in assets and liabilities: Accounts and notes receivable Inventores Prepaid expenses and other current assets Accounts payable and other current liabilities Income tauces payable Othernet Net Cash Provided by Operating Activities 221 (1,708) (531) (4.347) 619 (28) 2451 (253) (174) (200 (168) 201 338) (305) 10.030 9415 (3.282) (2.969) 180 (3.040) 134 (1.197) (299) sos (61) (2120 267 Investing Activities Capital spending Sales of property, plant and equipment Acquisition of SodaStream, net of cash and cash equivalents acquired Other acquisitions and investments in non controlled affiliates Divestitures Short-term investment, by original maturity: More than three months - purchases More than three months - maturities More than three months sales Three months or less, net Other investing.net Net Cash Provided by (Used for) Investing Activities (12500 (S4637) 12824 1.498 (18385) 15.741 790 29 4,564 (6.403) 150 1818 1509 (4.406) 105 (4,007) (1.589) C2504) 9 Financing Activities Proceeds from issuances of long-len det Payments of long-term deb Cash tender and exchange ollers debt redemptions Short-term borrowes, by onenal maturity: More than three months - proceeds More than three months - payments Three months or less.net Cash dividends paid Share repurchases common Share repurchaus preferred Proceeds from exercises of stock options Withholding tax payments on RSUS, PSUs and PE Punits converted Other financing Net Cash Used for Financing Activities Effect of exchange rate changes on cash and cash equivalents and restricted cash Net Increase in Cash and Cash Equivalents and Restricted Casla Cash and Cash Equivalents and Restricted Cash, Beginning of Year Cash and Cash Equivalents and Restricted Cash, End of Year (17) (1.352) (4.930) (2.000) (128) (1.016) (4472) (2.000) 27 1.505 (4.227) (2.000) 5 281 164 (130) (103) (53) 462 (105) (76) (4.186) (13,769) 10.657 10.769 5 10697