Answered step by step
Verified Expert Solution
Link Copied!

Question

1 Approved Answer

PART II. Given the distance-time data below of a car, compute for its speed. Make a distance-time graph and speed-time graph using the available data.
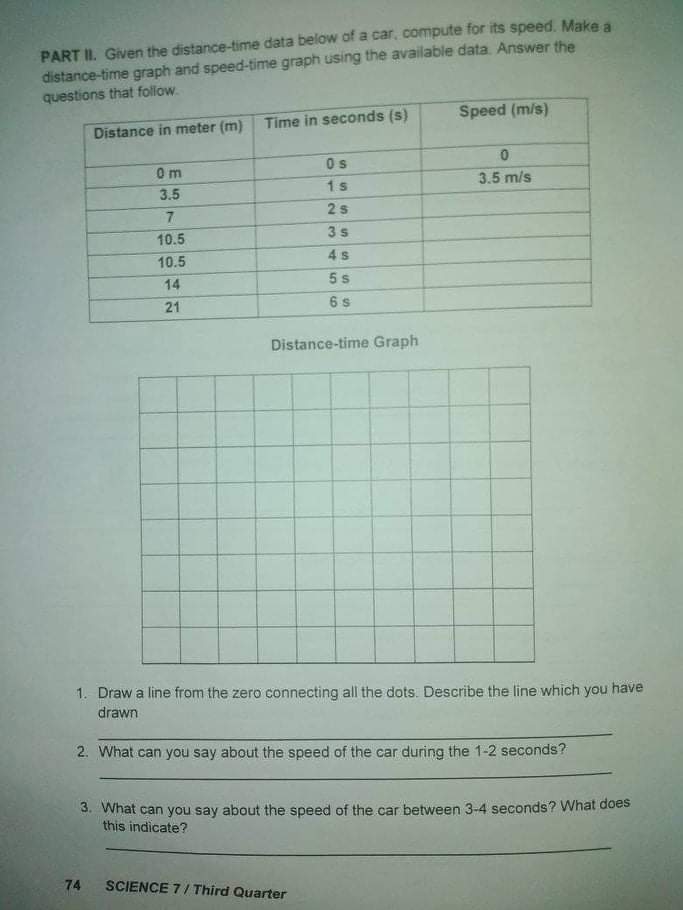
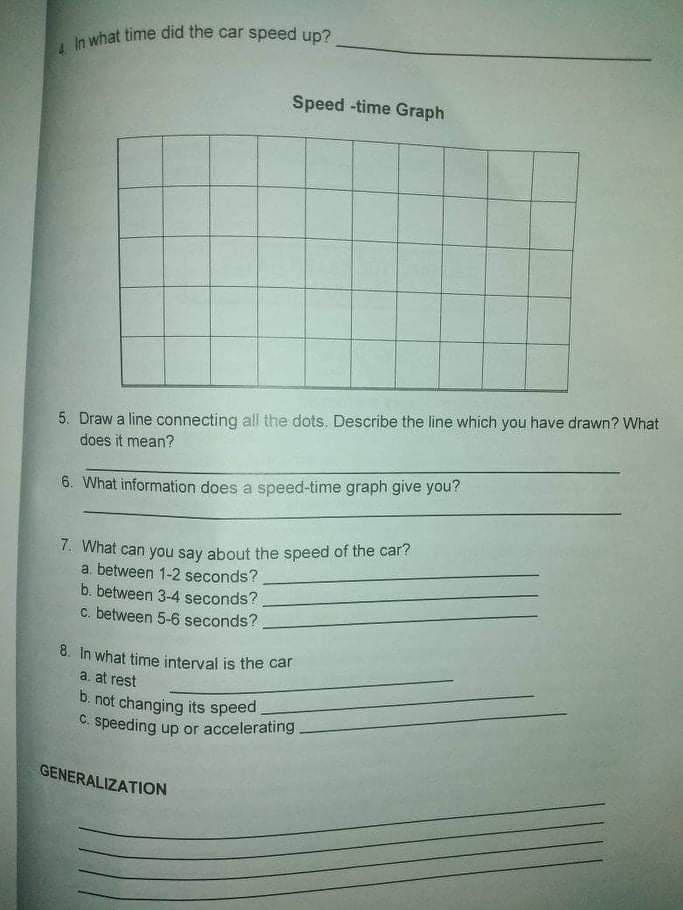
image text in transcribedimage text in transcribed
PART II. Given the distance-time data below of a car, compute for its speed. Make a distance-time graph and speed-time graph using the available data. Answer the questions that follow Distance in meter (m) Time in seconds (s) Speed (m/s) 0 m O s 0 3.5 15 3.5 m/s 7 2 s 10.5 3 5 10.5 4 5 14 5 s 21 6 s Distance-time Graph 1. Draw a line from the zero connecting all the dots. Describe the line which you have drawn 2. What can you say about the speed of the car during the 1-2 seconds? this indicate? 3. What can you say about the speed of the car between 3-4 seconds? What does 74 SCIENCE 7 / Third QuarterIn what time did the car speed up? Speed -time Graph 5. Draw a line connecting all the dots. Describe the line which you have drawn? What does it mean? 6. What information does a speed-time graph give you? 7. What can you say about the speed of the car? a between 1-2 seconds? b. between 3-4 seconds? C. between 5-6 seconds? 8. In what time interval is the car a. at rest b. not changing its speed c. speeding up or accelerating GENERALIZATION

Step by Step Solution

There are 3 Steps involved in it

Step: 1

blur-text-image

Get Instant Access to Expert-Tailored Solutions

See step-by-step solutions with expert insights and AI powered tools for academic success

Step: 2

blur-text-image

Step: 3

blur-text-image

Ace Your Homework with AI

Get the answers you need in no time with our AI-driven, step-by-step assistance

Get Started

Recommended Textbook for

Introduction to Solid State Physics

Authors: Charles Kittel

8th Edition

047141526X, 978-0471415268

More Books

Students also viewed these Physics questions

Question

=+ c. How would the change you describe in part

Answered: 1 week ago