Answered step by step
Verified Expert Solution
Question
1 Approved Answer
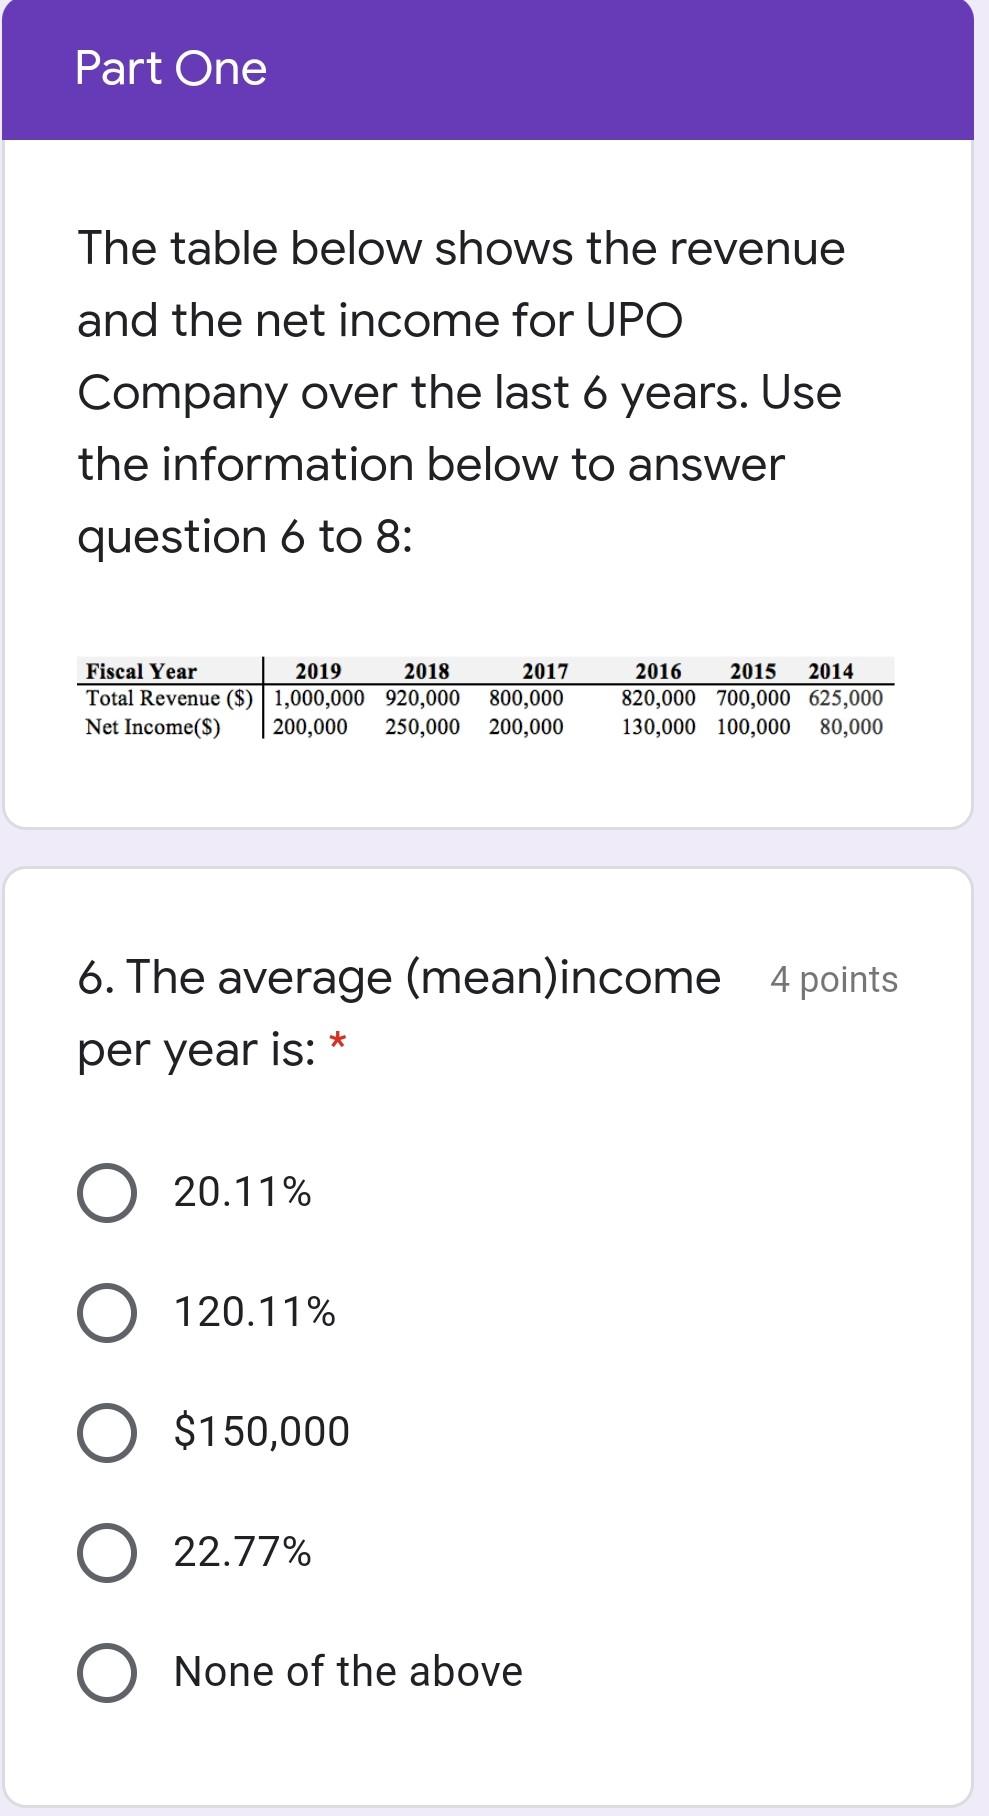
Part One The table below shows the revenue and the net income for UPO Company over the last 6 years. Use the information below to

Part One The table below shows the revenue and the net income for UPO Company over the last 6 years. Use the information below to answer question 6 to 8: Fiscal Year 2019 2018 Total Revenue ($) 1,000,000 920,000 Net Income(s) 200,000 250,000 2017 800,000 200,000 2016 2015 2014 820,000 700,000 625,000 130,000 100,000 80,000 6. The average (mean)income 4 points per year is: * 20.11% 120.11% $150,000 22.77% None of the above
Step by Step Solution
There are 3 Steps involved in it
Step: 1

Get Instant Access to Expert-Tailored Solutions
See step-by-step solutions with expert insights and AI powered tools for academic success
Step: 2

Step: 3

Ace Your Homework with AI
Get the answers you need in no time with our AI-driven, step-by-step assistance
Get Started


