

Question
PART THREE (45 Points) 3-1 Assuming that the data given below is information in the learning curve for an employee in producing a particular product.
PART THREE (45 Points)
3-1 Assuming that the data given below is information in the learning curve for an employee in producing a particular product.
a- Do you think that this employee can meet a demand of 10 units in three months if he works 8 hours a day? b- If not, how many units he can produce within 3 months. c- How should the learning curve of the employee to produce 10 units within 4 months
3-2 A candidate for mayor in a small town has allocated $40,000 for last-minute advertising in the days preceding the election. Two types of ads will be used: radio and television. Each radio ad costs $200 and reaches an estimated 3,000 people. Each television ad costs $500 and reaches an estimated 7,000 people. In planning the advertising campaign, the campaign manager would like to reach as many people as possible, but she has stipulated that at least 10 ads of each type must be used. Also, the number of radio ads must be at least as great as the number of television ads. How many ads of each type should be used? How many people will this reach?
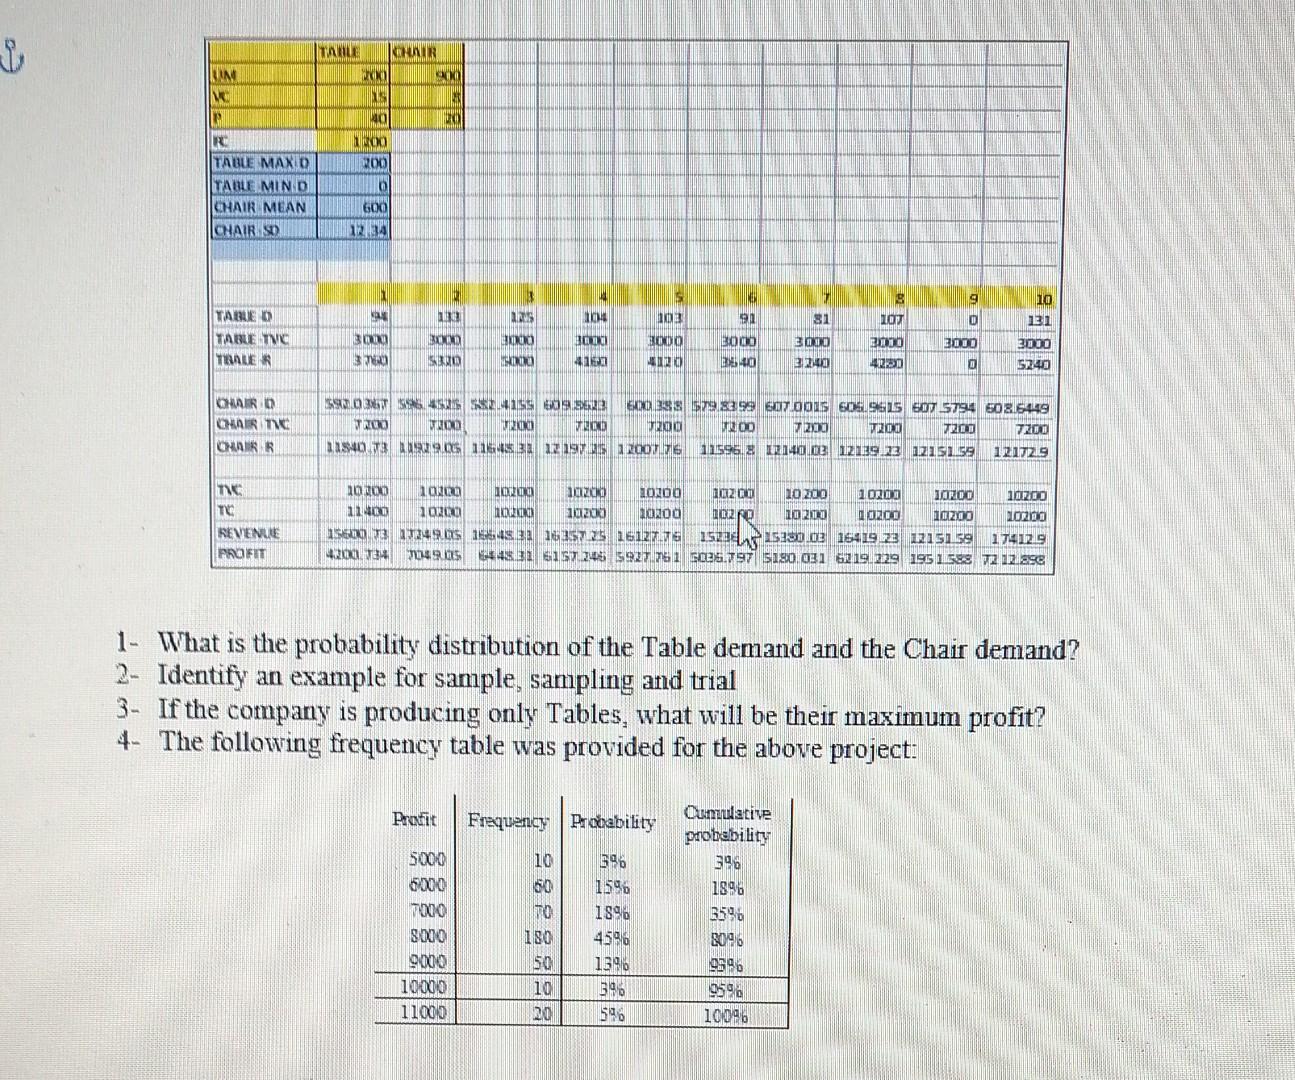
3-3 The following table presents a risk analysis for XYZ Furniture.
1- What is the probability distribution of the Table demand and the Chair demand? 2- Identify an example for sample, sampling and trial 3- If the company is producing only Tables, what will be their maximum profit? 4- The following frequency table was provided for the above project:
The manger wants to take a decision on the above project, what should be the manager decision if: a) The manger can accept profit of $8000 or above b) The manager can accept profit of $8000 c) The manager can accept profit of $7000
TARDE CHAIR UN DO SK OR d 20 RC 200 200 O TABLE MAXD TABLE MIND CNAIR MEAN CHAIRSO 009 12 34 6 TABLED NON ELE 104 103 16 31 SAT QUE 9 LOT 2010 4230 O 2000 10 131 3000 5240 DUDE QONDE BODO CLUE TABLE TVC TRAUER BONI 3 BXXX SBD CRAS SORO 4192 4120 ORE 3240 0 CHAIR EK EN MERE O 5 ALL SUND EXC985779.83.99 0.0005 608.9615 SOT 5794 508.5449 E- TIDO 200 TLD 200 12:00 T200 7200 7200 10807329.00 13121200726 111596. 2140 03 12139 13 1215159 12172.9 COLA 000 ONUR R cozot DO ZIT CULOT LLLLLLLL CONDITION TINC TE REVENUE PROFIT 10200 20.000 10200 10200 10100 10 200 10700 10.200 11400 10120 10 101200 10200 1020 10 2110 101200 10/2000 1550 23 2249.05 180 26257 1612 TG 1522 15391 02 154 19 1215159 174129 420 734 204964453 S 245 592766026.797 5180.031 6219 229 195 11589 2128 1- What is the probability distribution of the Table demand and the Chair demand? 2- Identify an example for sample, sampling and trial 3. If the company is producing only Tables, what will be their maximum profit? 4. The following frequency table was provided for the above project: Profit Frequency Probability 10 50 TO 5000 5000 7000 8000 9000 10000 11000 596 1596 1896 4596 1396 396 Cumulative probability 590 1998 3596 8096 9596 180 50 10 20 9656 10096
Step by Step Solution
There are 3 Steps involved in it
Step: 1

Get Instant Access to Expert-Tailored Solutions
See step-by-step solutions with expert insights and AI powered tools for academic success
Step: 2

Step: 3
Ace Your Homework with AI
Get the answers you need in no time with our AI-driven, step-by-step assistance
Get Started
Beginning C# 5.0 Databases
Authors: Vidya Vrat Agarwal
2nd Edition
1430242604, 978-1430242604