Answered step by step
Verified Expert Solution
Question
1 Approved Answer
PARTS A B C PLEASE 1) Use the table below to answer the first set of questions. The variables are: Fatalityrate: total number of accidents
PARTS A B C PLEASE 
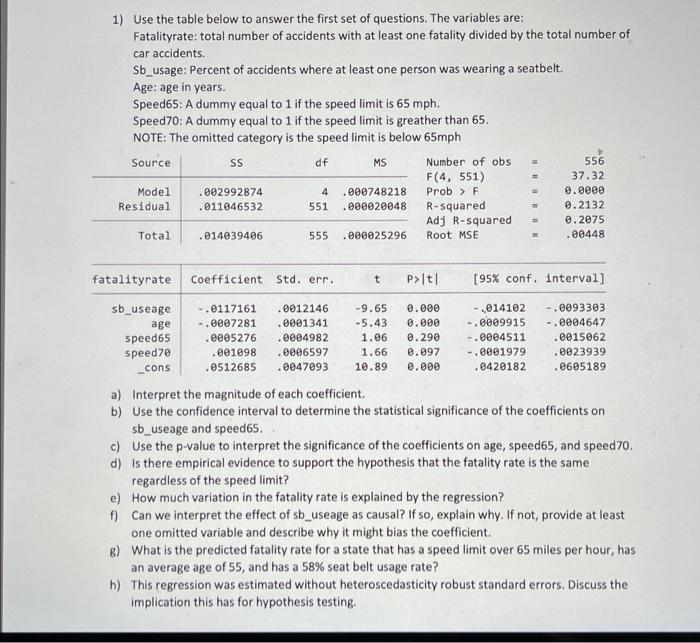
1) Use the table below to answer the first set of questions. The variables are: Fatalityrate: total number of accidents with at least one fatality divided by the total number of car accidents. Sb_usage: Percent of accidents where at least one person was wearing a seatbelt. Age: age in years. Speed65: A dummy equal to 1 if the speed limit is 65mph. Speed70: A dummy equal to 1 if the speed limit is greather than 65 . NOTE: The omitted category is the speed limit is below 65mph a) Interpret the magnitude of each coefficient. b) Use the confidence interval to determine the statistical significance of the coefficients on sb_useage and speed65. c) Use the p-value to interpret the significance of the coefficients on age, speed65, and speed70. d) Is there empirical evidence to support the hypothesis that the fatality rate is the same regardless of the speed limit? e) How much variation in the fatality rate is explained by the regression? f) Can we interpret the effect of sb_useage as causal? If so, explain why. If not, provide at least one omitted variable and describe why it might bias the coefficient. g) What is the predicted fatality rate for a state that has a speed limit over 65 miles per hour, has an average age of 55 , and has a 58% seat belt usage rate? h) This regression was estimated without heteroscedasticity robust standard errors. Discuss the implication this has for hypothesis testing 
Step by Step Solution
There are 3 Steps involved in it
Step: 1

Get Instant Access to Expert-Tailored Solutions
See step-by-step solutions with expert insights and AI powered tools for academic success
Step: 2

Step: 3

Ace Your Homework with AI
Get the answers you need in no time with our AI-driven, step-by-step assistance
Get Started


