

Answered step by step
Verified Expert Solution
Question
1 Approved Answer
Paste A 14 A Evaluating Risk and Return Bartman Industries. Reynolds Inc. Year Stock Price 2020 $17.70 $1.09 $47.25 2019 $14.90 $1.01 $50.30 2018 $16.80
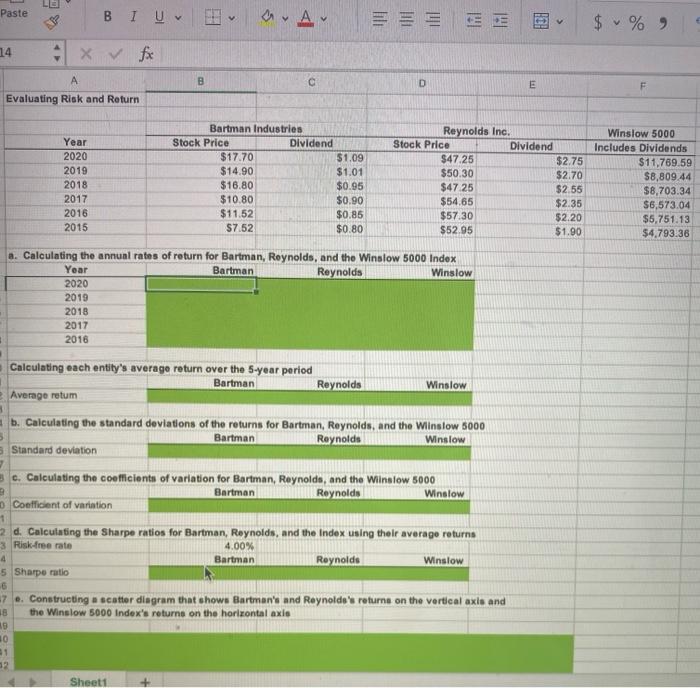
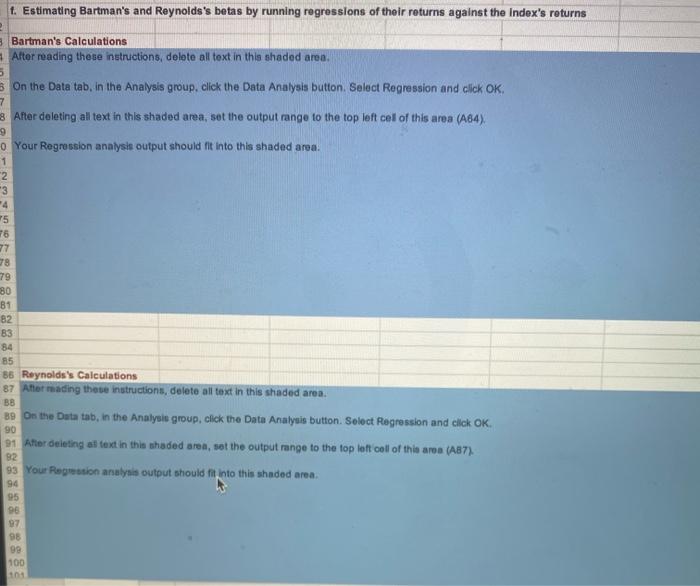
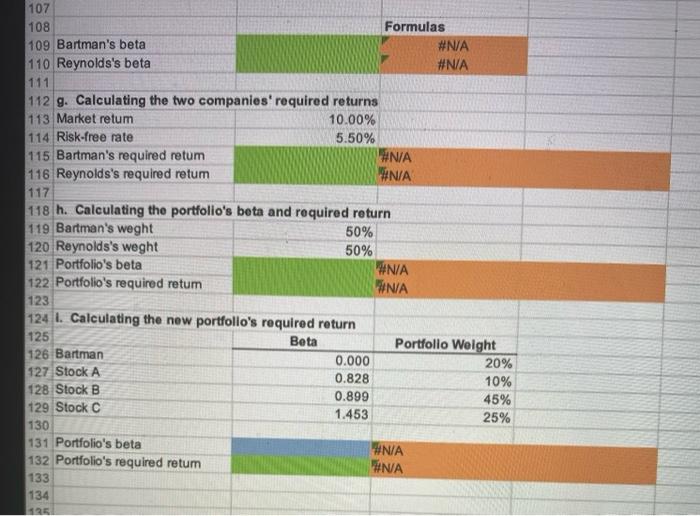 Paste A 14 A Evaluating Risk and Return Bartman Industries. Reynolds Inc. Year Stock Price 2020 $17.70 $1.09 $47.25 2019 $14.90 $1.01 $50.30 2018 $16.80 $0.95 $47.25 2017 $10.80 $0.90 $54.65 2016 $11.52 $0.85 $57.30 2015 $7.52 $0.80 $52.95 a. Calculating the annual rates of return for Bartman, Reynolds, and the Winslow 5000 Index Year Bartman Reynolds Winslow 2020 2019 2018 2017 2016 Calculating each entity's average return over the 5-year period Bartman Reynolds Winslow Average retum b. Calculating the standard deviations of the returns for Bartman, Reynolds, and the Winslow 5000 3 Bartman Reynolds Winslow Standard deviation c. Calculating the coefficients of variation for Bartman, Reynolds, and the Winslow 5000 B Bartman Reynolds Winslow Coefficient of variation 1 2 d. Calculating the Sharpe ratios for Bartman, Reynolds, and the Index using their average returns 3 Risk-free rate 4.00% 4 Bartman Reynolds Winslow 5 Sharpe ratio 6 7 e. Constructing a scatter diagram that shows Bartman's and Reynolds's returns on the vertical axis and the Winslow 5000 Index's returns on the horizontal axis 18 19 Sheet1 40 LE 41 32 BIU E B x fx V Dividend D Stock Price E REA E Dividend $2.75 $2.70 $2.55 $2.35 $2.20 $1.90 $ % 9 Winslow 5000 Includes Dividends $11,769.59 $8,809.44 $8,703.34 $6,573.04 $5,751.13 $4,793.36 f. Estimating Bartman's and Reynolds's betas by running regressions of their returns against the index's returns 2 3 Bartman's Calculations 1 After reading these instructions, delete all text in this shaded area. 5 On the Data tab, in the Analysis group, click the Data Analysis button. Select Regression and click OK. 7 3 After deleting all text in this shaded area, set the output range to the top left cell of this area (A64). 9 0 Your Regression analysis output should fit into this shaded area. 1 2 80 81 82 83 84 85 86 Reynolds's Calculations 87 After reading these instructions, delete all text in this shaded area. BB 89 On the Data tab, in the Analysis group, click the Data Analysis button. Select Regression and click OK. 90 91 After deleting all text in this shaded area, set the output range to the top left cell of this area (AB7). 92 93 Your Regression analysis output should fit into this shaded area. 94 95 96 97 98 99 100 3 4 75 76 77 78 79 107 108 109 Bartman's beta 110 Reynolds's beta 111 112 g. Calculating the two companies' required returns 113 Market retum 10.00% 114 Risk-free rate 5.50% 115 Bartman's required retum #N/A 116 Reynolds's required retum #N/A 117 118 h. Calculating the portfolio's beta and required return 119 Bartman's weght 50% 120 Reynolds's weght 50% 121 Portfolio's beta 122 Portfolio's required retum 123 124 1. Calculating the new portfolio's required return 125 Beta 126 Bartman 0.000 127 Stock A 0.828 128 Stock B 0.899 129 Stock C 1.453 130 131 Portfolio's beta 132 Portfolio's required retum 133 134 135 Formulas #N/A #N/A #N/A #N/A Portfolio Weight #N/A #N/A 20% 10% 45% 25%
Step by Step Solution
There are 3 Steps involved in it
Step: 1

Get Instant Access to Expert-Tailored Solutions
See step-by-step solutions with expert insights and AI powered tools for academic success
Step: 2

Step: 3
Ace Your Homework with AI
Get the answers you need in no time with our AI-driven, step-by-step assistance
Get Started
Emotions In Finance Booms Busts And Uncertainty
Authors: Jocelyn Pixley
2nd Edition
1107633370, 978-1107633377