

Question
Patagonia, Inc. was founded in May, 2000 by Lawrence Rollins, who was employed for the last 20 years as a river rafting guide. Mr. Rollins
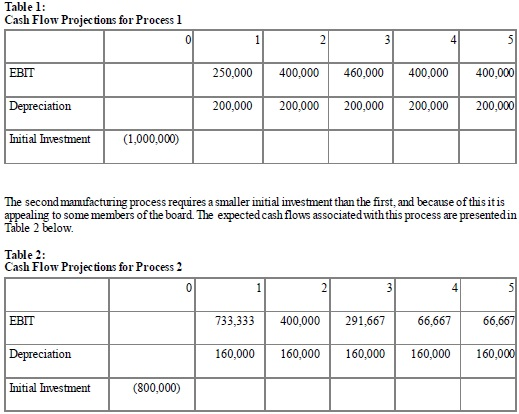
Patagonia, Inc. was founded in May, 2000 by Lawrence Rollins, who was employed for the last 20 years as a river rafting guide. Mr. Rollins received an unexpected inheritance of $2,000,000 in January, 2000. Soon after, he decided to leave his lifelong career in river rafting and use his inheritance as seed capital for Patagonia. During the first few years of its existence, Patagonia experienced steady sales growth, although the company has only recently shown positive net income. It is March, 2016 and the company is considering two alternative processes for manufacturing inflatable tubes to service demand in a rapidly growing market. Management intends to make the initial investment in the project at the end of April, 2016 and expects any cash flows associated with the project to arrive yearly, beginning at the end of April, 2017. The first manufacturing process has a higher start-up cost than the second, but greater economies of scale. The expected cash flows associated with this process are presented below in Table 1. Table 1: Cash Flow Projections for Process 1 0 1 2 3 4 5 EBIT 250,000 400,000 460,000 400,000 400,000 Depreciation 200,000 200,000 200,000 200,000 200,000 Initial Investment (1,000,000) The second manufacturing process requires a smaller initial investment than the first, and because of this it is appealing to some members of the board. The expected cash flows associated with this process are presented in Table 2 below. Table 2: Cash Flow Projections for Process 2 0 1 2 3 4 5 EBIT 733,333 400,000 291,667 66,667 66,667 Depreciation 160,000 160,000 160,000 160,000 160,000 Initial Investment (800,000) The marginal tax rate for the company is 40% and after careful assessment of the risk associated with this project, you conclude that the appropriate cost of capital for both processes is 9.75% Plot the NPV profiles for the two projects and present the graph as an Exhibit in your report (see figure 5.6 on page 153 of the RWJ text for an example of how to do this). Explain the relevance of the crossover point. How would you convince the board that the NPV method is best?
Step by Step Solution
There are 3 Steps involved in it
Step: 1

Get Instant Access to Expert-Tailored Solutions
See step-by-step solutions with expert insights and AI powered tools for academic success
Step: 2

Step: 3
Ace Your Homework with AI
Get the answers you need in no time with our AI-driven, step-by-step assistance
Get Started
Offshore Finance And State Power
Authors: Andrea Binder
1st Edition
0192870122, 978-0192870124