

Question
Payload deflection data was obtained as a function of time for a Tower Crane. The Excel data file (craneData.xlsx) has been uploaded to the T-square
Payload deflection data was obtained as a function of time for a Tower Crane. The Excel data file (craneData.xlsx) has been uploaded to the T-square site and is automatically imported into the provided MATLAB project script if it is placed in the same directory as the script.
The free response of the tower crane payload deflection could be modeled by a damped sine function, such as
y(t) = Ce(tt0) cos((t t0) + ) + B (1)
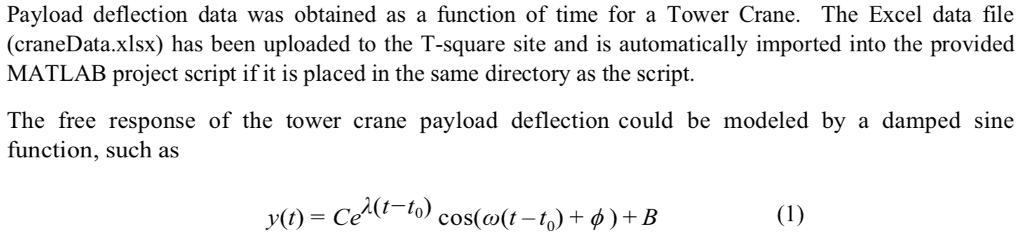
where: C = initial amplitude, = exponential decay constant, = frequency, t0 = time offset, = phase
angle at t = t0, and B = deflection measurement offset, or bias
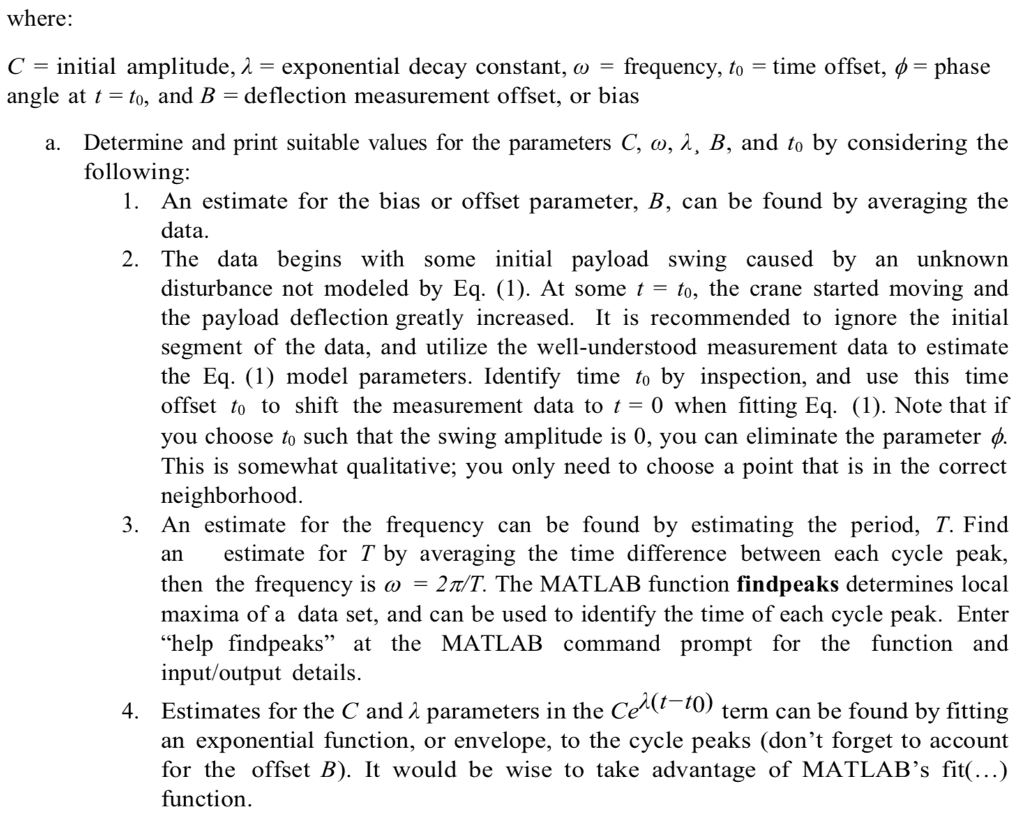
a. Determine and print suitable values for the parameters C, , B, and t0 by considering the following:
An estimate for the bias or offset parameter, B, can be found by averaging the data.
The data begins with some initial payload swing caused by an unknown disturbance not modeled by Eq. (1). At some t = t0, the crane started moving and the payload deflection greatly increased. It is recommended to ignore the initial segment of the data, and utilize the well-understood measurement data to estimate the Eq. (1) model parameters. Identify time t0 by inspection, and use this time offset t0 to shift the measurement data to t = 0 when fitting Eq. (1). Note that if you choose t0 such that the swing amplitude is 0, you can eliminate the parameter . This is somewhat qualitative; you only need to choose a point that is in the correct neighborhood.
An estimate for the frequency can be found by estimating the period, T. Find
an estimate for T by averaging the time difference between each cycle peak, then the frequency is = 2/T. The MATLAB function findpeaks determines local maxima of a data set, and can be used to identify the time of each cycle peak. Enter help findpeaks at the MATLAB command prompt for the function and input/output details.
4. Estimates for the C and parameters in the Ce(tt0) term can be found by fitting an exponential function, or envelope, to the cycle peaks (dont forget to account for the offset B). It would be wise to take advantage of MATLABs fit(...) function.
Use the MATLAB function Function.m attached below:
%Start Code
close all;
craneData = xlsread('craneData.xlsx');
figure(2);
hold on;
plot(craneData(:,1),craneData(:,2));
xlabel('Time (s)'); ylabel('Deflection');
title('Provided Crane Data');
% Find bias parameter
%***CODE GOES HERE***
% Find time offset by inspection; resize and shift data array
%***INSERT VALUE FOR t0 HERE***
t0 = 0;
i = find(craneData(:,1) == t0);
craneData_t0 = craneData(i:end,:);
craneData_t0(:,1) = craneData_t0(:,1) - t0;
% Find peaks in data
%***CODE GOES HERE***
% Estimate the period and frequency
%***CODE GOES HERE***
% Fit exponential
%***CODE GOES HERE***
% Print Parameters
%***CODE GOES HERE***
% Generate plot
%***CODE GOES HERE***
%End Code
Data Set (rename to Crane Data.xlsx before use) can be found at https:// anonfile . com/X6Y913d1b7/Crane_Data.xlsx
Payload deflection data was obtained as a function of time for a Tower Crane. The Excel data file (craneData.xlsx) has been uploaded to the T-square site and is automatically imported into the provided MATLAB project script if it is placed in the same directory as the script The free response of the tower crane payload deflection could be modeled by a damped sine function, such as y(t) = Ce Payload deflection data was obtained as a function of time for a Tower Crane. The Excel data file (craneData.xlsx) has been uploaded to the T-square site and is automatically imported into the provided MATLAB project script if it is placed in the same directory as the script The free response of the tower crane payload deflection could be modeled by a damped sine function, such as y(t) = CeStep by Step Solution
There are 3 Steps involved in it
Step: 1

Get Instant Access to Expert-Tailored Solutions
See step-by-step solutions with expert insights and AI powered tools for academic success
Step: 2

Step: 3
Ace Your Homework with AI
Get the answers you need in no time with our AI-driven, step-by-step assistance
Get Started
Advances In Databases And Information Systems Associated Workshops And Doctoral Consortium Of The 13th East European Conference Adbis 2009 Riga Latvia September 2009 Revised Selected Papers Lncs 5968
Authors: Janis Grundspenkis ,Marite Kirikova ,Yannis Manolopoulos ,Leonids Novickis
2010th Edition
3642120814, 978-3642120817