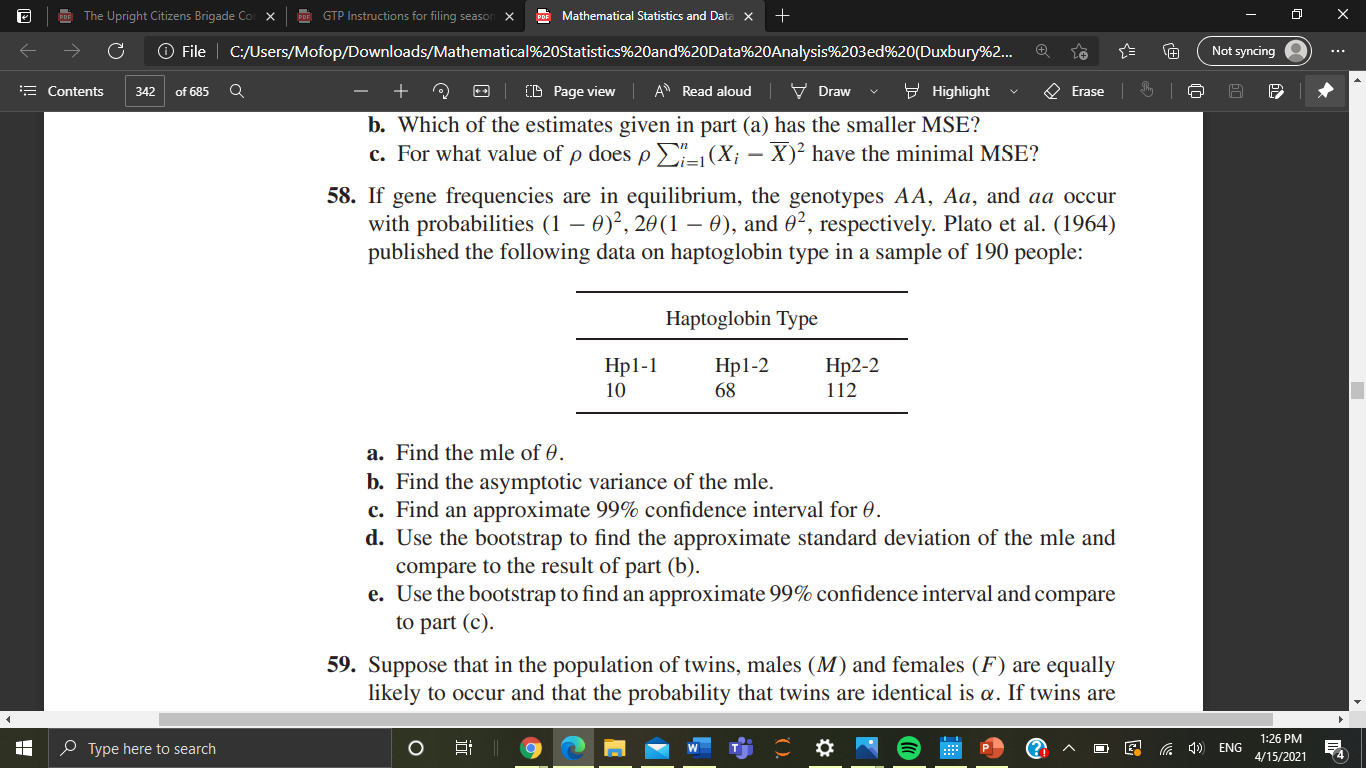
PDF The Upright Citizens Brigade Cor X QBE GTP Instructions for filing season X BE Mathematical Statistics and Data X + X G File | C:/Users/Mofop/Downloads/Mathematical%20Statistics%20and%20Data%20Analysis%203ed%20(Duxbury%2... Not syncing =Contents 342 of 685 Q + Q Page view A Read aloud Draw Highlight Erase b. Which of the estimates given in part (a) has the smaller MSE? c. For what value of p does p _1_, (X; - X) have the minimal MSE? 58. If gene frequencies are in equilibrium, the genotypes AA, Aa, and aa occur with probabilities (1 - 0)2, 20(1 - 0), and 02, respectively. Plato et al. (1964) published the following data on haptoglobin type in a sample of 190 people: Haptoglobin Type Hp1-1 Hp1-2 Hp2-2 10 68 112 a. Find the mle of 0. b. Find the asymptotic variance of the mle. c. Find an approximate 99% confidence interval for 0. d. Use the bootstrap to find the approximate standard deviation of the mle and compare to the result of part (b). e. Use the bootstrap to find an approximate 99% confidence interval and compare to part (c). 59. Suppose that in the population of twins, males (M) and females (F) are equally likely to occur and that the probability that twins are identical is a. If twins are Type here to search O 1 9 W P ?a 1:26 PM ENG 4/15/2021Bb Course Content - EN.553.430. x Stat430/630_Mar24_Lecture X Stat430_630_Spring2021_Hon X STAT 4520 Unit #5: Sufficient X *STATISTICS 550.430 : Introduc> + X C D A blackboard.jhu.edu/bbcswebdav/pid-9745153-dt-content-rid-102619576_2/courses/EN.553.430.01.SP21/Stat430_630_Spring2021_Homework6%2.. 9 # E Stat430_630_Spring2021_Homework6(3).pdf 1 / 5 90% + Problem 1. Rice, Exercise 58, page 325. Make sure you read 8.5.1, pages 272-274, on Hardy-Weinberg equilibrium, and example C on page 283, before you do this. HINT: This problem asks you to use the bootstrap procedure to estimate the sampling distribution of the MLE. Here are the basic steps, along with some simple R code to implement this. You should read through this code, implement it, and then see how you might want to modify it to adapt it to the particular assigned exercise. a) First, you want to use data you have to generate estimates for multinomial cell probabilities. Let p = (P1, p2, p3) be your estimates for these cell probabilities. b) Next, consider drawing 1000 realizations of a multinomial experiment with a total number of 190 objects to be placed in one of K = 3 bins (where is 190 and K = 3 coming from?), with a vector of probabilities p. Here is a snippet of code that will achieve this objective; in this case, the probability vector p is given by p = (0.2, 0.3, 0.5), for example, and the results of these multinomial realizations are saved in an array called multinom: >multinom + X C D A blackboard.jhu.edu/bbcswebdav/pid-9745153-dt-content-rid-102619576_2/courses/EN.553.430.01.SP21/Stat430_630_Spring2021_Homework6%2.. 9 # E Stat430_630_Spring2021_Homework6(3).pdf 15 90% + >multinom