

Question
. Peppy Pet Company, a large manufacturer of pet food products, conducted a study in this past spring in order to assess how its brand
.
Peppy Pet Company, a large manufacturer of pet
food products, conducted a study in this past spring
in order to assess how its brand of dog food was
faring in the market. Questionnaires were mailed to a
panel of 1260 families with a dog. The Peppy Pet
brand had three major competitors: Brand A, Brand
B, and Brand C. A similar study conducted the year
before had indicated the following market shares:
Peppy Pet, 31.75% (400 families); Brand A, 25%
(315 families); Brand B, 32.54% (410 families); and
Brand C, 10.71% (135 families). The present study
indicated that Peppy Pet's market share had not
changed during the one-year period. However, Brand
B increased its market share to 36.5% (460 fa
milies). This increase could be accounted for by a
decrease in Brand A's and Brand C's market shares
(Brand A now had a share of 22.23%, or 280 fa
milies; Brand C now had a share of 9.52%, or 120
families). The management of the Peppy Pet Com
pany decided it had little to worry about.
The new study also revealed some additional
facts. Over the one-year period, 70 families from
Brand A and 30 families from Brand C had switched
to Peppy Pet. Five families from Brand B and 30
families from Brand C had switched to Brand A, while
none of the Peppy Pet users had switched to Brand
A. These facts further reassured management. Fi
nally, 45 families switched from Brand B to Brand C,
but none of the families using Peppy Pet or Brand A
had switched to Brand C. Brand C's loyalty was es
timated to be .556.
a. Do you think that the management of the Peppy
Pet Company was accurate in its analysis of the
situation? Justify your answer.
b. You are called upon to do some analysis. From the
preceding data, construct the brand-switching
matrix.
c. Indicate what this matrix reveals for each of the
brands over the one-year period.
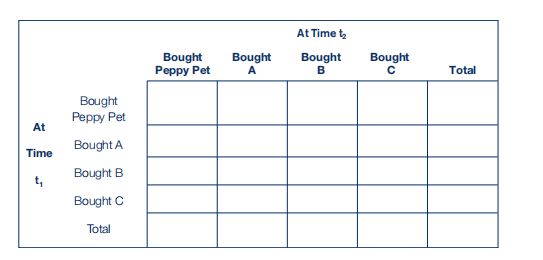
d. Complete the following table and compute brand
loyalties.
e. What can be said about the degree of brand
loyalty for each of the four products?

Step by Step Solution
There are 3 Steps involved in it
Step: 1

Get Instant Access to Expert-Tailored Solutions
See step-by-step solutions with expert insights and AI powered tools for academic success
Step: 2

Step: 3
Ace Your Homework with AI
Get the answers you need in no time with our AI-driven, step-by-step assistance
Get Started
Entropy And Diversity The Axiomatic Approach
Authors: Tom Leinster
1st Edition
1108962173, 9781108962179