Answered step by step
Verified Expert Solution
Question
1 Approved Answer
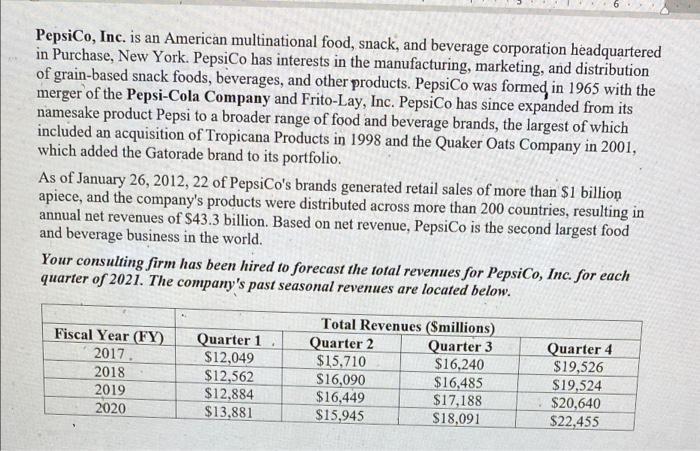
PepsiCo, Inc. is an American multinational food, snack, and beverage corporation headquartered in Purchase, New York. PepsiCo has interests in the manufacturing, marketing, and


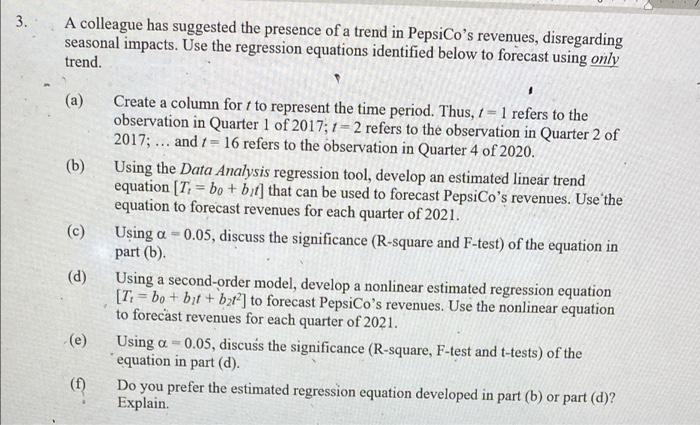
PepsiCo, Inc. is an American multinational food, snack, and beverage corporation headquartered in Purchase, New York. PepsiCo has interests in the manufacturing, marketing, and distribution of grain-based snack foods, beverages, and other products. PepsiCo was formed in 1965 with the merger of the Pepsi-Cola Company and Frito-Lay, Inc. PepsiCo has since expanded from its namesake product Pepsi to a broader range of food and beverage brands, the largest of which included an acquisition of Tropicana Products in 1998 and the Quaker Oats Company in 2001, which added the Gatorade brand to its portfolio. As of January 26, 2012, 22 of PepsiCo's brands generated retail sales of more than $1 billion apiece, and the company's products were distributed across more than 200 countries, resulting in annual net revenues of $43.3 billion. Based on net revenue, PepsiCo is the second largest food and beverage business in the world. Your consulting firm has been hired to forecast the total revenues for PepsiCo, Inc. for each quarter of 2021. The company's past seasonal revenues are located below. Total Revenues (Smillions) Fiscal Year (FY) Quarter 1 Quarter 2 Quarter 3 Quarter 4 2017 $12,049 $15,710 $16,240 $19,526 2018 $12,562 $16,090 $16,485 $19,524 2019 $12,884 $16,449 $17,188 $20,640 2020 $13,881 $15,945 $18,091 $22,455 3. A colleague has suggested the presence of a trend in PepsiCo's revenues, disregarding seasonal impacts. Use the regression equations identified below to forecast using only trend. (a) (b) (c) (d) (e) (f) Create a column fort to represent the time period. Thus, 1= 1 refers to the observation in Quarter 1 of 2017; 1-2 refers to the observation in Quarter 2 of 2017;... and 16 refers to the observation in Quarter 4 of 2020. Using the Data Analysis regression tool, develop an estimated linear trend equation [T: bo + bit] that can be used to forecast PepsiCo's revenues. Use the equation to forecast revenues for each quarter of 2021. Using a 0.05, discuss the significance (R-square and F-test) of the equation in part (b). Using a second-order model, develop a nonlinear estimated regression equation [T: bo+ bit+b2t2] to forecast PepsiCo's revenues. Use the nonlinear equation to forecast revenues for each quarter of 2021. Using a 0.05, discuss the significance (R-square, F-test and t-tests) of the equation in part (d). Do you prefer the estimated regression equation developed in part (b) or part (d)? Explain.
Step by Step Solution
★★★★★
3.38 Rating (170 Votes )
There are 3 Steps involved in it
Step: 1
To forecast the total revenues for PepsiCo Inc for each quarter of 2021 using regression analysis well follow the steps outlined below a Create a column for t to represent the time period Since the gi...
Get Instant Access to Expert-Tailored Solutions
See step-by-step solutions with expert insights and AI powered tools for academic success
Step: 2

Step: 3

Ace Your Homework with AI
Get the answers you need in no time with our AI-driven, step-by-step assistance
Get Started


