Answered step by step
Verified Expert Solution
Link Copied!

Question

1 Approved Answer

Per Capita GNI Population Core Rank Semi-Peripheral Per Capita GNI Peripheral Per Capita GNI 5.1 1 2 3 4 5 6 7 8 9 10
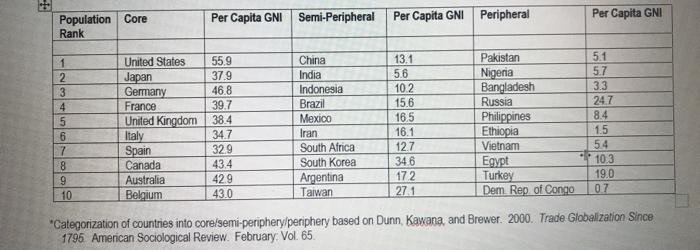
image text in transcribed
Per Capita GNI Population Core Rank Semi-Peripheral Per Capita GNI Peripheral Per Capita GNI 5.1 1 2 3 4 5 6 7 8 9 10 United States 55.9 Japan 37.9 Germany 468 France 39.7 United Kingdom 38.4 Italy 347 Spain 329 Canada 43.4 Australia 429 Belgium 43.0 China India Indonesia Brazil Mexico Iran South Africa South Korea Argentina Taiwan 13.1 5.6 10.2 15.6 16.5 16.1 12.7 346 172 27.1 Pakistan Nigeria Bangladesh Russia Philippines Ethiopia Vietnam Egypt Turkey Dem Rep of Congo 5.7 3.3 24.7 8.4 1.5 5.4 - 103 19.0 07 Categorization of countries into core/semi-periphery periphery based on Dunn Kawana, and Brewer. 2000. Trade Globalization Since 1795 American Sociological Review. February, Vol. 65. 3) In terms of the categories within the scale of measurement, the per capita GNI statistics in the table above are which type of data?: 1 Mark 4) The reason for my answer in Q1 is (type in a short explanation): 2 Marks

Step by Step Solution

There are 3 Steps involved in it

Step: 1

blur-text-image

Get Instant Access to Expert-Tailored Solutions

See step-by-step solutions with expert insights and AI powered tools for academic success

Step: 2

blur-text-image

Step: 3

blur-text-image

Ace Your Homework with AI

Get the answers you need in no time with our AI-driven, step-by-step assistance

Get Started

Recommended Textbook for

The Management Audit How To Create An Effective Management Team

Authors: Michael Craig-Cooper, Philippe De Backer

1st Edition

0273600044, 978-0273600046

More Books

Students also viewed these Accounting questions

Question

Evaluate employees readiness for training. page 275

Answered: 1 week ago