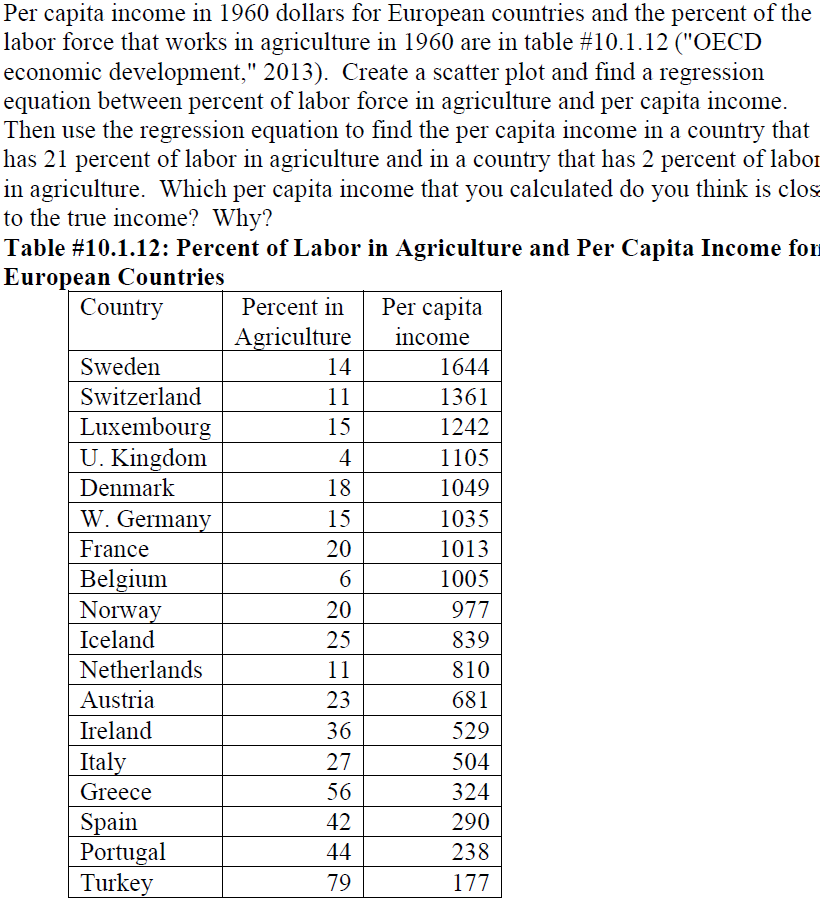
Per capita income in 1960 dollars for European countries and the percent of the labor force that works in agriculture in 1960 are in

Per capita income in 1960 dollars for European countries and the percent of the labor force that works in agriculture in 1960 are in table #10.1.12 ("OECD economic development," 2013). Create a scatter plot and find a regression equation between percent of labor force in agriculture and per capita income. Then use the regression equation to find the per capita income in a country that has 21 percent of labor in agriculture and in a country that has 2 percent of labor in agriculture. Which per capita income that you calculated do you think is clos to the true income? Why? Table #10.1.12: Percent of Labor in Agriculture and Per Capita Income for European Countries Country Sweden Percent in Per capita Agriculture income 14 1644 Switzerland 11 1361 Luxembourg 15 1242 U. Kingdom 4 1105 Denmark 18 1049 W. Germany 15 1035 France 20 1013 Belgium 6 1005 Norway 20 977 Iceland 25 839 Netherlands 11 810 Austria 23 681 Ireland 36 529 Italy 27 504 Greece 56 324 Spain 42 290 Portugal 44 238 Turkey 79 177
Step by Step Solution
There are 3 Steps involved in it
Step: 1

See step-by-step solutions with expert insights and AI powered tools for academic success
Step: 2

Step: 3

Ace Your Homework with AI
Get the answers you need in no time with our AI-driven, step-by-step assistance
Get Started


