Answered step by step
Verified Expert Solution
Link Copied!

Question

1 Approved Answer

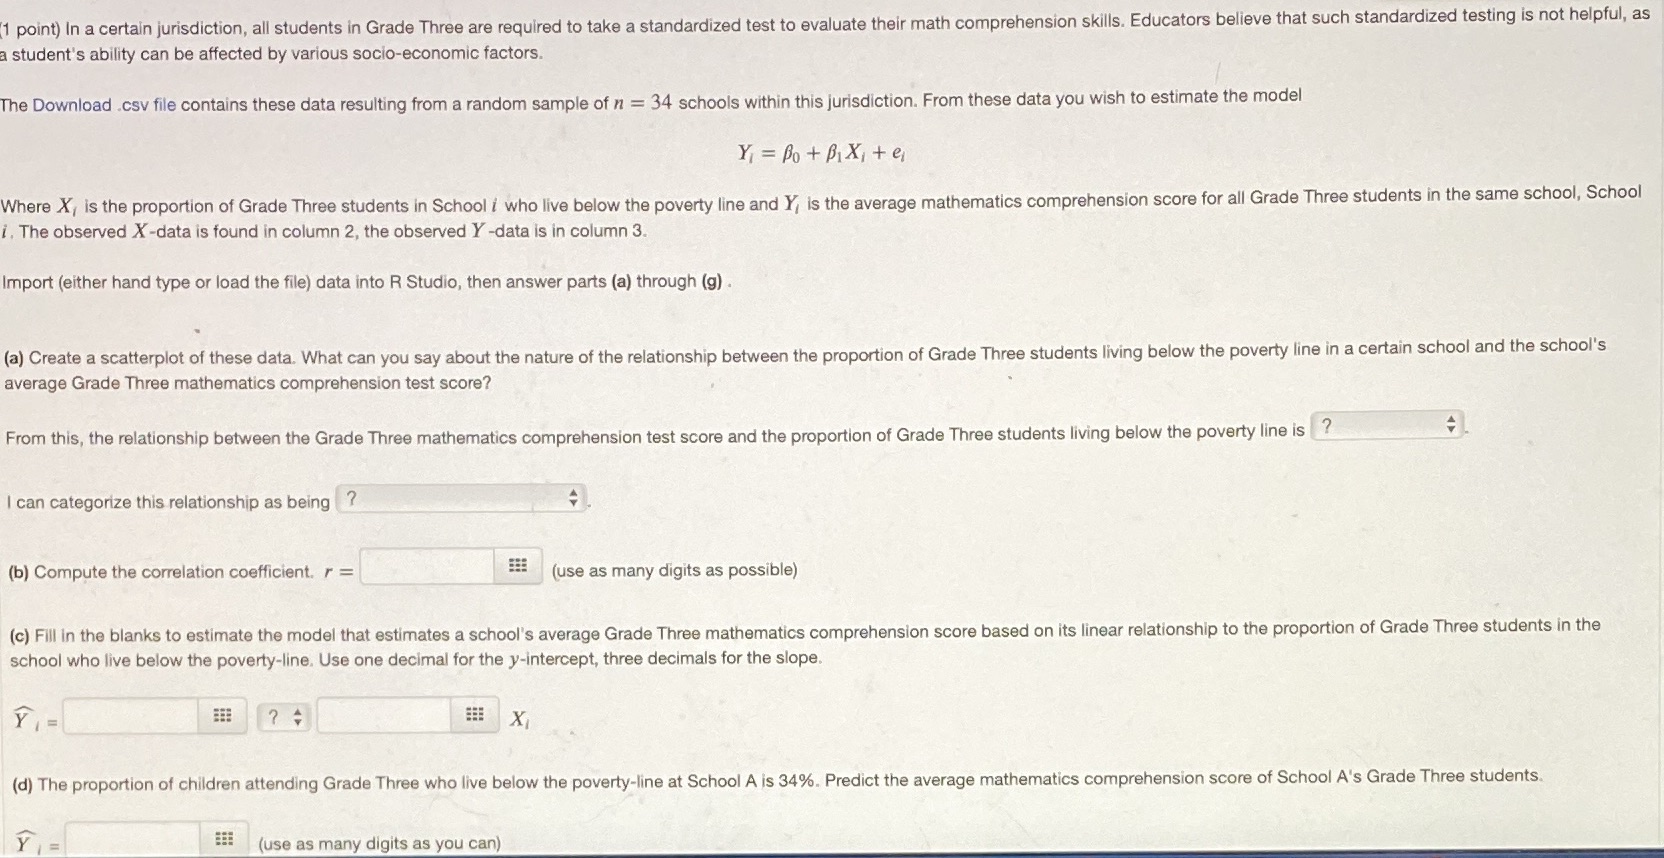
,perbelowpoverty,mathscore1,61.93,160.322,56.64,167.393,56.88,167.394,62.72,177.655,64.61,161.376,54.51,175.947,55.85,174.878,67.22,157.489,70.45,158.7810,52.15,164.9511,61.93,164.912,64.38,164.3613,57.91,169.1414,66.59,156.2515,61.93,162.8716,70.06,160.0217,58.46,167.8218,60.43,176.7919,55.38,165.9920,71.87,148.2221,47.02,191.7222,60.35,167.2823,65.4,156.1724,46.7,202.8125,55.93,174.3426,59.33,159.7227,55.46,186.4928,59.09,179.729,55.22,176.3730,62.01,163.4931,63.75,169.2932,64.46,163.333,50.88,187.2234,56.01,187.02 1 point) In a certain jurisdiction, all students in Grade Three are required to take a standardized test to evaluate their math comprehension skills.

"","perbelowpoverty","mathscore""1",61.93,160.32"2",56.64,167.39"3",56.88,167.39"4",62.72,177.65"5",64.61,161.37"6",54.51,175.94"7",55.85,174.87"8",67.22,157.48"9",70.45,158.78"10",52.15,164.95"11",61.93,164.9"12",64.38,164.36"13",57.91,169.14"14",66.59,156.25"15",61.93,162.87"16",70.06,160.02"17",58.46,167.82"18",60.43,176.79"19",55.38,165.99"20",71.87,148.22"21",47.02,191.72"22",60.35,167.28"23",65.4,156.17"24",46.7,202.81"25",55.93,174.34"26",59.33,159.72"27",55.46,186.49"28",59.09,179.7"29",55.22,176.37"30",62.01,163.49"31",63.75,169.29"32",64.46,163.3"33",50.88,187.22"34",56.01,187.02

image text in transcribed
1 point) In a certain jurisdiction, all students in Grade Three are required to take a standardized test to evaluate their math comprehension skills. Educators believe that such standardized testing is not helpful, as student's ability can be affected by various socio-economic factors. The Download .csv file contains these data resulting from a random sample of n = 34 schools within this jurisdiction. From these data you wish to estimate the model Y1 = Po + BIX,+ er Where X, is the proportion of Grade Three students in School / who live below the poverty line and Y, is the average mathematics comprehension score for all Grade Three students in the same school, School i. The observed X-data is found in column 2, the observed Y -data is in column 3. Import (either hand type or load the file) data into R Studio, then answer parts (a) through (g) . (a) Create a scatterplot of these data. What can you say about the nature of the relationship between the proportion of Grade Three students living below the poverty line in a certain school and the school's average Grade Three mathematics comprehension test score? From this, the relationship between the Grade Three mathematics comprehension test score and the proportion of Grade Three students living below the poverty line is ? I can categorize this relationship as being |? (b) Compute the correlation coefficient. r = (use as many digits as possible) (c) Fill in the blanks to estimate the model that estimates a school's average Grade Three mathematics comprehension score based on its linear relationship to the proportion of Grade Three students in the school who live below the poverty-line. Use one decimal for the y-intercept, three decimals for the slope. Y = BEE X (d) The proportion of children attending Grade Three who live below the poverty-line at School A is 34%. Predict the average mathematics comprehension score of School A's Grade Three students. Y = (use as many digits as you can)

Step by Step Solution

There are 3 Steps involved in it

Step: 1

blur-text-image

Get Instant Access to Expert-Tailored Solutions

See step-by-step solutions with expert insights and AI powered tools for academic success

Step: 2

blur-text-image

Step: 3

blur-text-image

Ace Your Homework with AI

Get the answers you need in no time with our AI-driven, step-by-step assistance

Get Started

Recommended Textbook for

Precalculus Enhanced With Graphing Utilities (Subscription)

Authors: Michael, Michael Sullivan III, Michael III Sullivan, III Sullivan

6th Edition

ISBN: 0321849108, 9780321849106

More Books

Students also viewed these Mathematics questions

Question

3. Describe the communicative power of group affiliations

Answered: 1 week ago