Answered step by step
Verified Expert Solution
Question
1 Approved Answer
percent deviation 15% 10% 5% 0%. -5% -10% -15% -20% -25% -30% -35% There 9/4/80 9/4/81 9/6/82 9/6/83 9/5/84 9/5/85 98/9/6 9/7/87 - 9/6/88

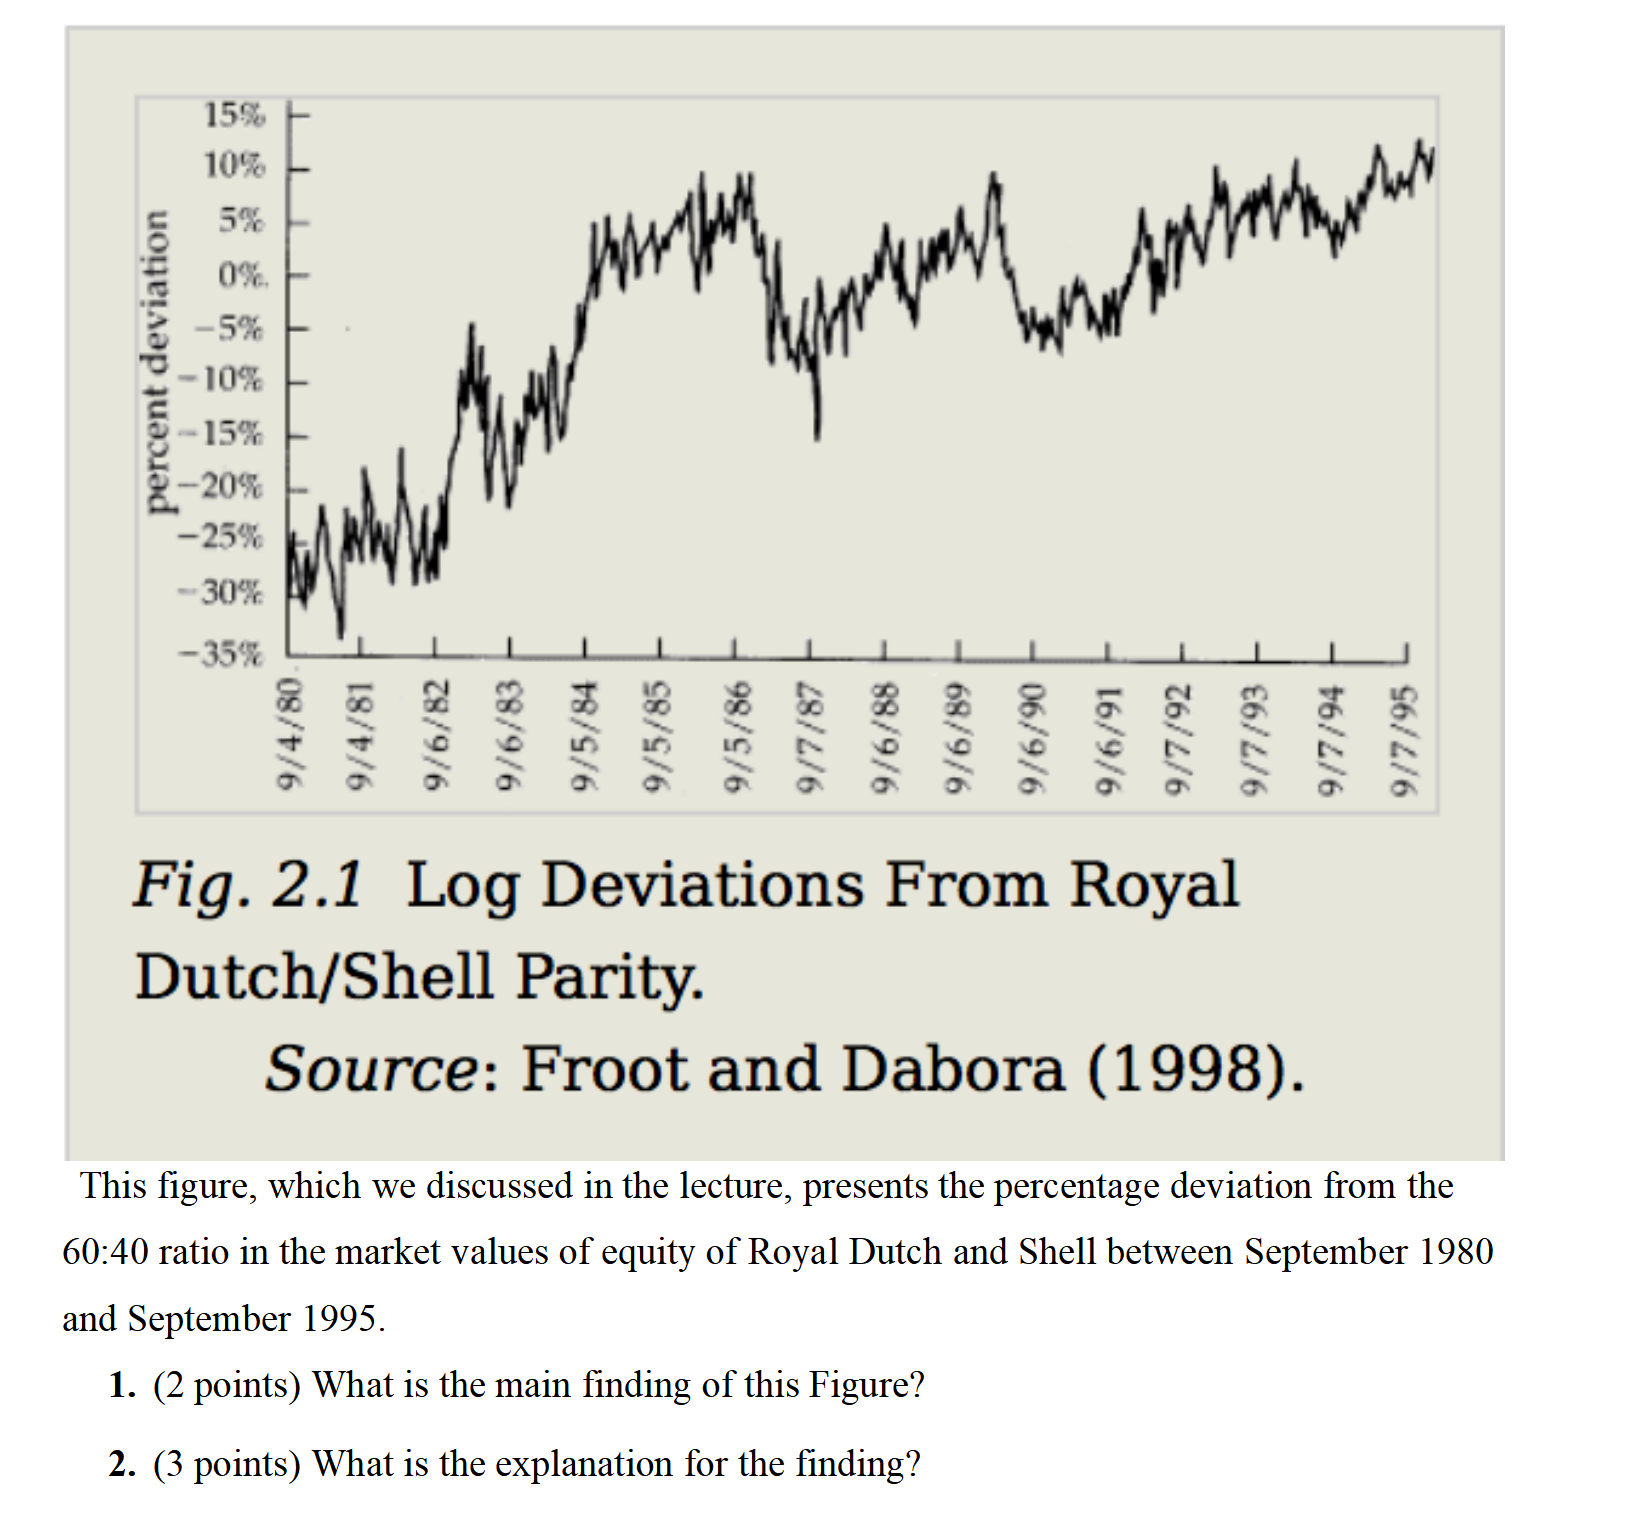
percent deviation 15% 10% 5% 0%. -5% -10% -15% -20% -25% -30% -35% There 9/4/80 9/4/81 9/6/82 9/6/83 9/5/84 9/5/85 98/9/6 9/7/87 - 9/6/88 9/6/89 - 9/6/90 winn 16/9/6 9/7/92- 9/7/93 9/7/94 9/7/95 Fig. 2.1 Log Deviations From Royal Dutch/Shell Parity. Source: Froot and Dabora (1998). This figure, which we discussed in the lecture, presents the percentage deviation from the 60:40 ratio in the market values of equity of Royal Dutch and Shell between September 1980 and September 1995. 1. (2 points) What is the main finding of this Figure? 2. (3 points) What is the explanation for the finding?
Step by Step Solution
★★★★★
3.41 Rating (148 Votes )
There are 3 Steps involved in it
Step: 1
The image presents a graph titled Fig 21 Log Deviations From Royal DutchShell Parity which was referenced in a lecture and shows the percentage deviat...
Get Instant Access to Expert-Tailored Solutions
See step-by-step solutions with expert insights and AI powered tools for academic success
Step: 2

Step: 3

Ace Your Homework with AI
Get the answers you need in no time with our AI-driven, step-by-step assistance
Get Started


