Answered step by step
Verified Expert Solution
Question
1 Approved Answer
Percent of Sales 2013 2014 2012 2013 2014 2015 2012 2015 Profit and loss statement Revenue Cost of goods sold Gross profit SG&A expense Depreciation
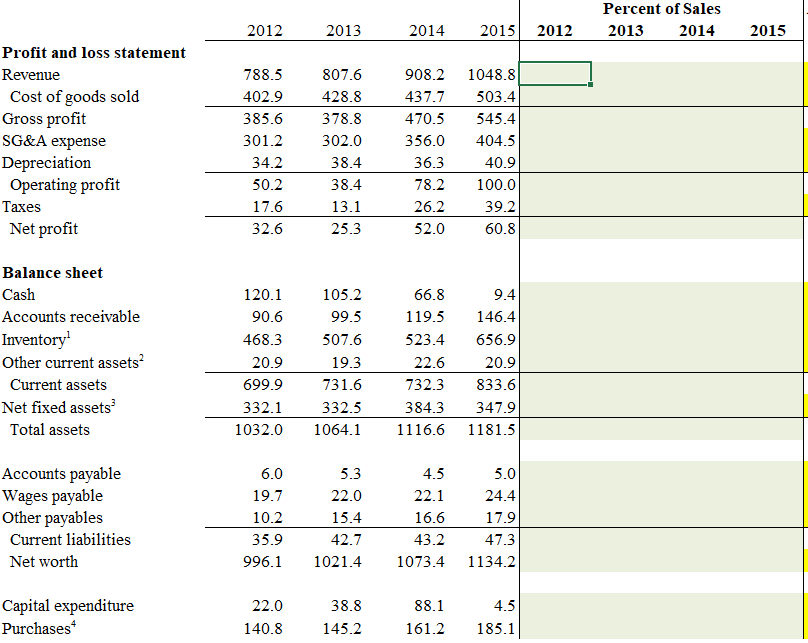
Percent of Sales 2013 2014 2012 2013 2014 2015 2012 2015 Profit and loss statement Revenue Cost of goods sold Gross profit SG&A expense Depreciation Operating profit Taxes Net profit 788.5 402.9 385.6 301.2 34.2 50.2 17.6 32.6 807.6 428.8 378.8 302.0 38.4 38.4 13.1 25.3 908.2 437.7 470.5 356.0 36.3 78.2 26.2 52.0 1048.8 503.4 545.4 404.5 40.9 100.0 39.2 60.8 Balance sheet Cash Accounts receivable Inventory? Other current assets? Current assets Net fixed assets Total assets 120.1 90.6 468.3 20.9 699.9 332.1 1032.0 105.2 99.5 507.6 19.3 731.6 332.5 1064.1 66.8 119.5 523.4 22.6 7323 384.3 1116.6 9.4 146.4 656.9 20.9 833.6 347.9 1181.5 Accounts payable Wages payable Other payables Current liabilities Net worth 6.0 19.7 10.2 35.9 996.1 5.3 22.0 15.4 42.7 1021.4 4.5 22.1 16.6 43.2 1073.4 5.0 24.4 17.9 47.3 1134.2 Capital expenditure Purchases 22.0 140.8 38.8 145.2 88.1 161.2 4.5 185.1
Step by Step Solution
There are 3 Steps involved in it
Step: 1
Get Instant Access to Expert-Tailored Solutions
See step-by-step solutions with expert insights and AI powered tools for academic success
Step: 2
Step: 3
Ace Your Homework with AI
Get the answers you need in no time with our AI-driven, step-by-step assistance
Get Started