

Answered step by step
Verified Expert Solution
Question
1 Approved Answer
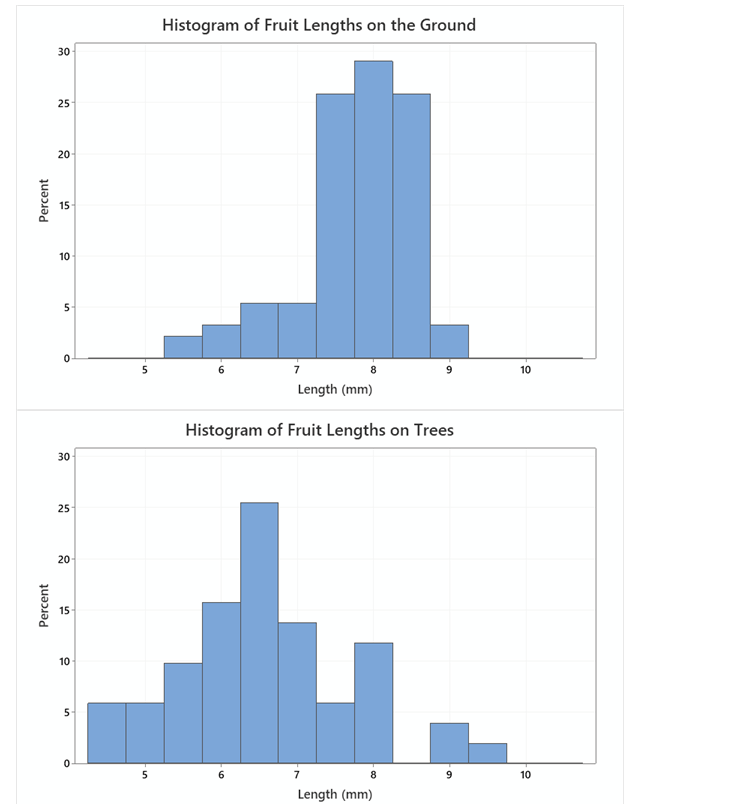
Percent Percent 30 25 20 15 10 3|) 25 Histogram of Fruit Lengths on the Ground G T E 9 Length [mm] Histogram of Fruit
Step by Step Solution
There are 3 Steps involved in it
Step: 1

Get Instant Access to Expert-Tailored Solutions
See step-by-step solutions with expert insights and AI powered tools for academic success
Step: 2

Step: 3
Ace Your Homework with AI
Get the answers you need in no time with our AI-driven, step-by-step assistance
Get Started