Answered step by step
Verified Expert Solution
Link Copied!

Question

1 Approved Answer

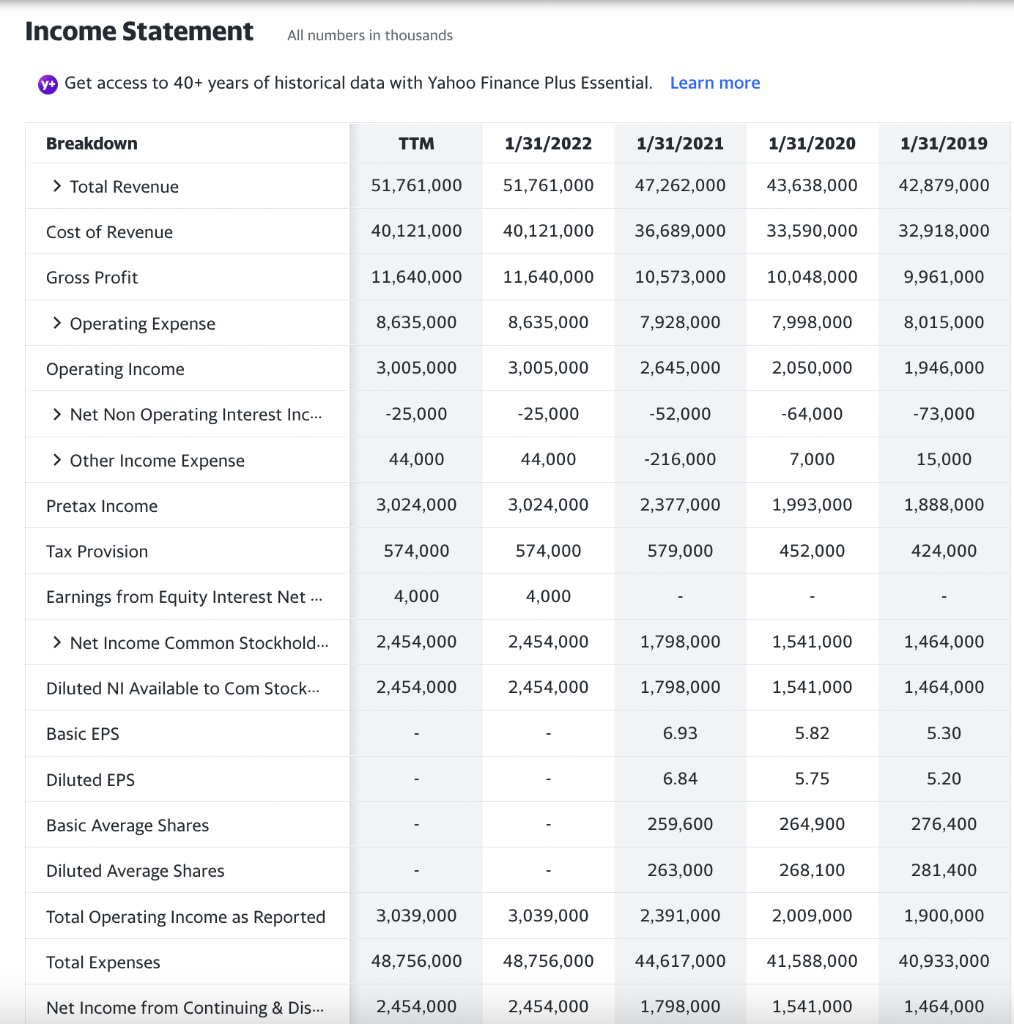
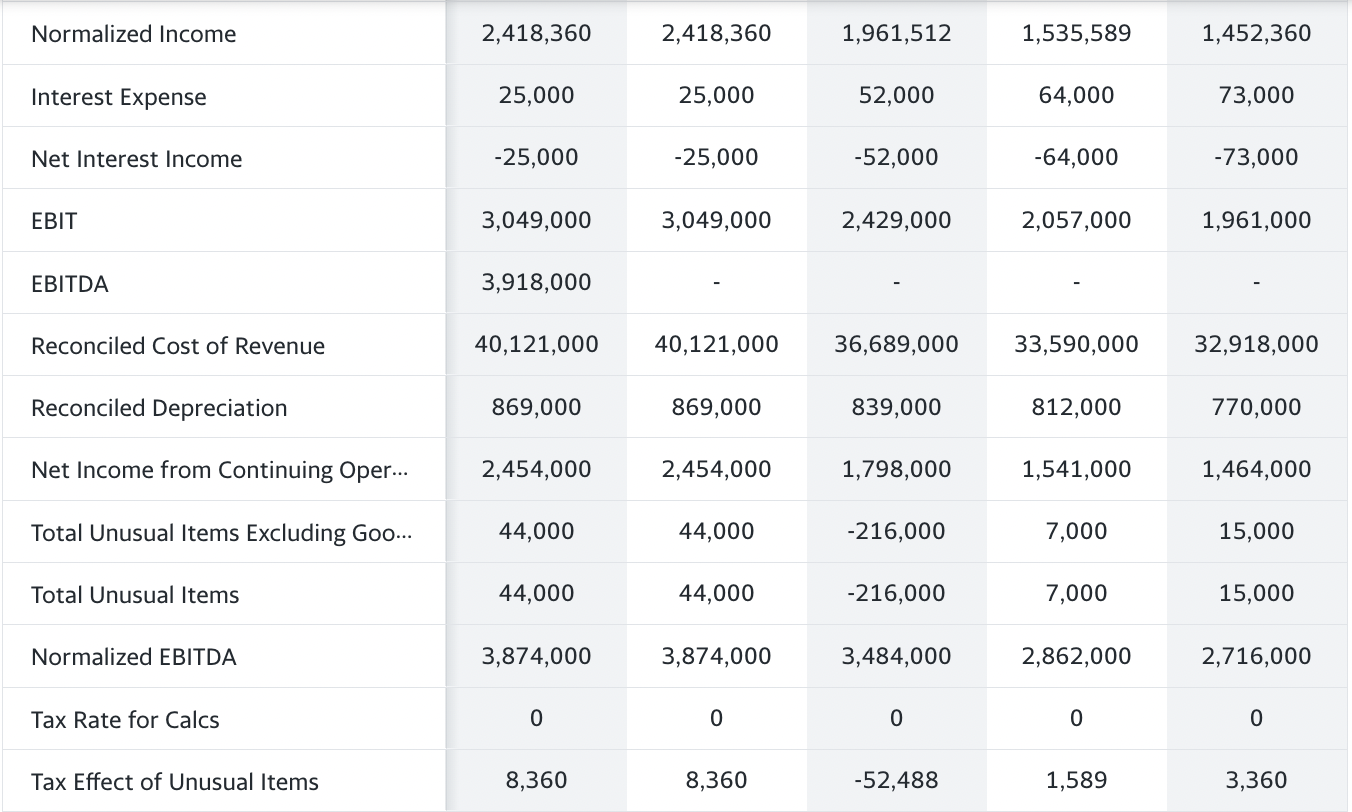
Perform a common size analysis for Best Buy. Income Statement All numbers in thousands Y+ Get access to 40+ years of historical data with Yahoo

Perform a common size analysis for Best Buy.

image text in transcribedimage text in transcribed

Income Statement All numbers in thousands Y+ Get access to 40+ years of historical data with Yahoo Finance Plus Essential. Learn more Breakdown TTM 1/31/2022 1/31/2021 1/31/2020 1/31/2019 > Total Revenue 51,761,000 51,761,000 47,262,000 43,638,000 42,879,000 Cost of Revenue 40,121,000 40,121,000 36,689,000 33,590,000 32,918,000 Gross Profit 11,640,000 11,640,000 10,573,000 10,048,000 9,961,000 > Operating Expense 8,635,000 8,635,000 7,928,000 7,998,000 8,015,000 Operating Income 3,005,000 3,005,000 2,645,000 2,050,000 1,946,000 > Net Non Operating Interest Inc... -25,000 -25,000 -52,000 -64,000 -73,000 > Other Income Expense 44,000 44,000 -216,000 7,000 15,000 Pretax Income 3,024,000 3,024,000 2,377,000 1,993,000 1,888,000 Tax Provision 574,000 574,000 579,000 452,000 424,000 Earnings from Equity Interest Net ... 4,000 4,000 > Net Income Common Stockhold... 2,454,000 2,454,000 1,798,000 1,541,000 1,464,000 Diluted NI Available to Com Stock... 2,454,000 2,454,000 1,798,000 1,541,000 1,464,000 Basic EPS 6.93 5.82 5.30 Diluted EPS 6.84 5.75 5.20 Basic Average Shares 259,600 264,900 276,400 Diluted Average Shares 263,000 268,100 281,400 Total Operating Income as Reported 3,039,000 3,039,000 2,391,000 2,009,000 1,900,000 Total Expenses 48,756,000 48,756,000 44,617,000 41,588,000 40,933,000 Net Income from Continuing & Dis... 2,454,000 2,454,000 1,798,000 1,541,000 1,464,000 Normalized Income 2,418,360 2,418,360 1,961,512 1,535,589 1,452,360 Interest Expense 25,000 25,000 52,000 64,000 73,000 Net Interest Income -25,000 -25,000 -52,000 -64,000 -73,000 EBIT 3,049,000 3,049,000 2,429,000 2,057,000 1,961,000 EBITDA 3,918,000 Reconciled Cost of Revenue 40,121,000 40,121,000 36,689,000 33,590,000 32,918,000 Reconciled Depreciation 869,000 869,000 839,000 812,000 770,000 Net Income from Continuing Oper... 2,454,000 2,454,000 1,798,000 1,541,000 1,464,000 Total Unusual Items Excluding Goo... 44,000 44,000 -216,000 7,000 15,000 Total Unusual Items 44,000 44,000 -216,000 7,000 15,000 Normalized EBITDA 3,874,000 3,874,000 3,484,000 2,862,000 2,716,000 Tax Rate for Calcs 0 0 0 0 0 Tax Effect of Unusual Items 8,360 8,360 -52,488 1,589 3,360

Step by Step Solution

There are 3 Steps involved in it

Step: 1

blur-text-image

Get Instant Access to Expert-Tailored Solutions

See step-by-step solutions with expert insights and AI powered tools for academic success

Step: 2

blur-text-image

Step: 3

blur-text-image

Ace Your Homework with AI

Get the answers you need in no time with our AI-driven, step-by-step assistance

Get Started

Recommended Textbook for

Stock Trading $Trategies For Self Directed Beginners

Authors: J.r. Zordi

1st Edition

1542378230, 978-1542378239

More Books

Students also viewed these Finance questions

Question

=+8. The board of directors has chosen (their, its) officers.

Answered: 1 week ago